The raw material markets edged higher in Q3. The commodity asset class consisting of 29 primary commodities traded on U.S. and U.K. exchanges moved 1.91% higher in Q3 2023. Over the first nine months of 2023, the asset class was only 0.12% higher. Commodities were 5.37% higher in 2022 and 26.79% higher in 2021. Rising interest rates and a strong US dollar weighed on some commodity prices, but geopolitics caused volatility in the asset class over the past years.
The U.S. dollar is typically a significant factor for commodity prices, as it tends to have an inverse value relationship with raw material prices. The dollar index moved 3.15% higher in Q3 and was 2.47% higher for the nine months of 2023. The rise in the dollar index was mostly bearish for many commodity prices.
The Fed increased the short-term Fed Funds Rate by only 25 basis points in Q3, but that did not stop the bond market from moving significantly lower. U.S. 30-Year Treasury bond futures fell 10.32% in Q3 and were 9.20% lower over the first nine months of 2023, after a 21.66% decline in 2022. The long bond fell 7.53% in 2021. Rising rates tend to be bearish for commodity prices.
Meanwhile, the commodity asset class reflected the economic and geopolitical landscapes in Q3, with gains in energy and losses in some of the rate-sensitive raw material markets.
Energy leads, while grains lag in Q3
Three of the six sectors posted gains in Q3, with energy leading the way on the upside with a 14.59% gain. Soft commodities rose 9.19% over the three months, while base metals edged only 0.18% higher.
Grains were the laggard, with an 8.89% decline. Animal proteins fell 3.40%, and precious metals posted a marginal 0.20% decline.
Four of six commodity sectors posted losses over the first nine months of 2023. Grains led the way lower with a 14.33% decline, followed by precious metals, which fell 12.32%. Base metals were down 10%, and energy dropped 2.80%. Soft commodities led the way on the upside with a 24.99% gain, and animal proteins were up 15.18% from the end of 2022 through September 29, 2023.
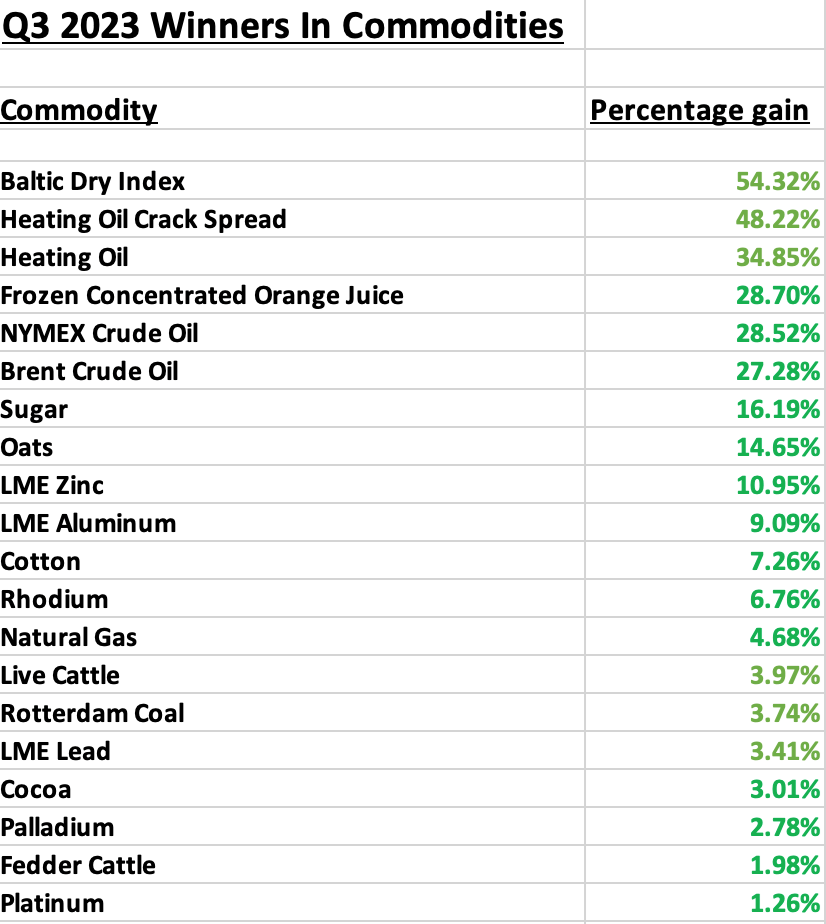
Winners in Q3 and over the first nine months of 2023
During the period from July through September 2023, twenty products moved higher, with nine posting double-digit percentage gains. The list of gains is as follows:
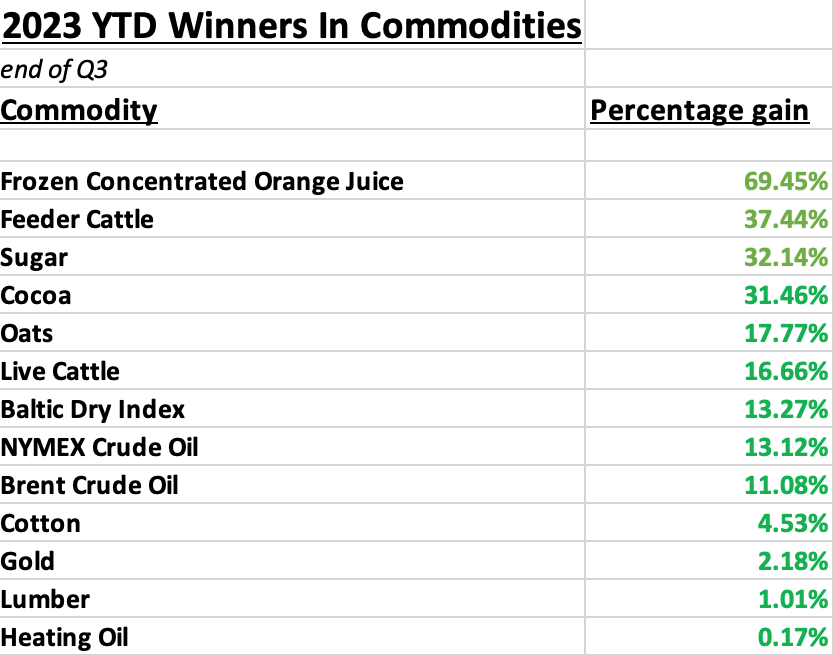
From the end of 2022 through September 29, 2023, thirteen products posted gains, with nine posting double-digit percentage gains. The list of gains is as follows:
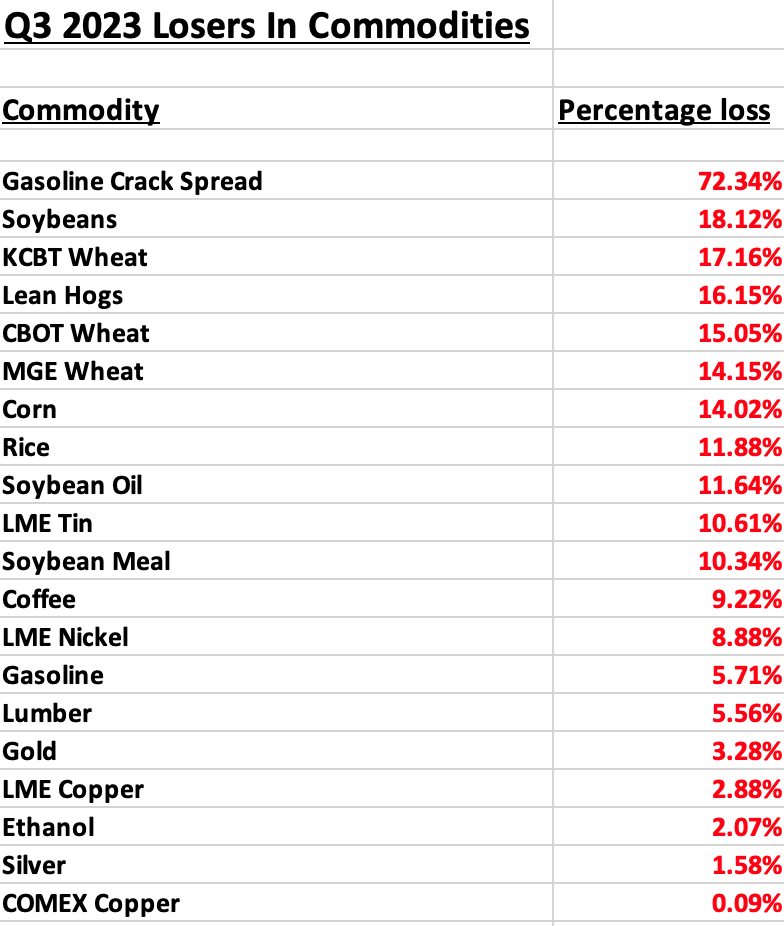
Losers in Q3 and over the first nine months of 2023
Twenty commodities posted losses in the third quarter of 2023. There were eleven double-digit percentage losers in Q3:
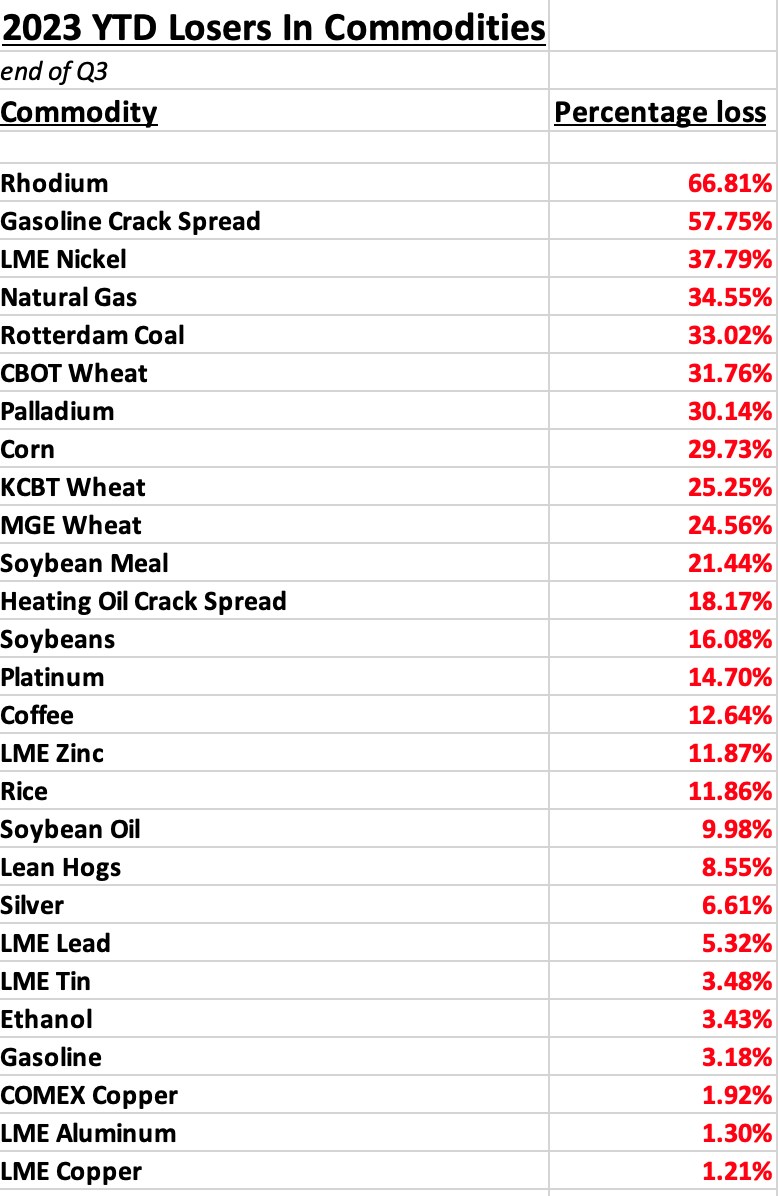
Twenty-seven commodities posted losses over the first nine months of 2023. There were seventeen double-digit percentage losers over the period:
Heating oil was the leader in Q3, but FCOJ has soared since the end of last year- Keep an eye on energy commodities in Q4
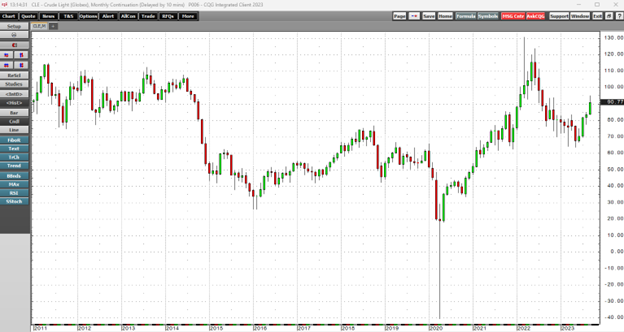
Heating oil posted the most significant gain in Q3 as the oil product proxy for distillates was up nearly 35%.
The monthly chart highlights the oil product’s rise. Heating oil outperformed gasoline and crude oil as the 2023 peak driving season ended after the summer.
Meanwhile, frozen orange juice futures were the leading gainer since the end of 2022.
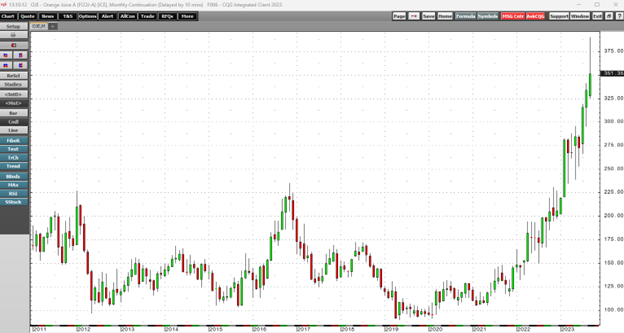
The monthly chart highlights that frozen concentrated orange juice futures rose 69.45% over the first nine months of 2023. The OJ futures reached a $3.90 per pound high before closing Q3 at around the $3.50 level. Before 2023, the all-time high was $2.35 per pound in November 2016. FCOJ futures remained in a bullish trend at the end of September 2023.
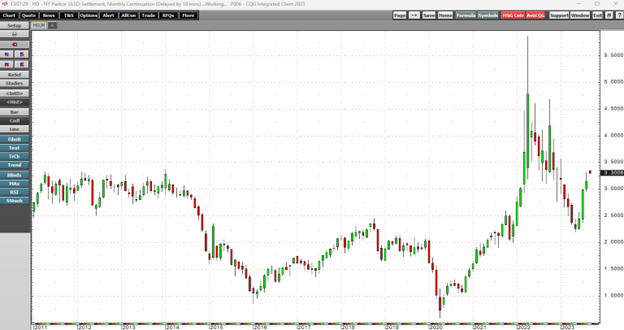
As the commodities asset class moves into the final quarter of 2023, keep a close eye on oil prices.
The monthly NYMEX crude oil futures chart shows the 51.2% decline from the fourteen-year $130.50 high in March 2020 to $63.64 per barrel in May 2023, where the energy commodity found a bottom. Over the past months, crude oil has rallied 49.3%, reaching a $95.03 high in September. At over $90 per barrel on September 29, the oil futures remained in a bullish trend. Petroleum remains the energy commodity that powers the world. While the Fed’s inflation indicators exclude “volatile food and energy prices,” oil is critical for all goods and services prices. Rising crude oil translates to higher inflationary pressures.
Meanwhile, OPEC+’s control of worldwide oil supplies and prices puts the path of least resistance of the energy commodity beyond the Fed’s monetary policy reach. Geopolitics, instead of economics, will play the leading role in crude oil’s price direction over the coming weeks and months. The crude oil market will be a significant inflation barometer reflecting the growing tensions between the U.S. and OPEC+. Higher oil prices increase the cost of all commodity production, putting upward pressure on the asset class.
Expect volatility in markets across all asset classes.
Rising interest rates, a strong U.S. dollar, rising U.S. debt, and geopolitical turmoil create a volatile cocktail for markets across all asset classes going into Q4.
Stocks and bonds are entering the final quarter of 2023 with bearish trends. Commodity prices have been volatile, with recent strength in energy, animal proteins, and soft commodities and weakness in metals and grains. I believe metals and grains will find bottoms sooner instead of later. I respect the bullish trends in energy and soft commodities. Natural gas could surprise on the upside if temperatures fall below seasonal averages during the winter.
Continue to expect the unexpected in Q4 and into 2024. Attention to risk-reward and discipline will allow you to survive volatile market conditions. Take advantage of opportunities, but have a plan, write it down, and stick to that plan. Do not allow trades to become long-term investments because prices move contrary to expectations. Remember that you are always long or short at the current market price, not at the original execution price. Adjust risk-reward based on the latest price. Moreover, develop logical risk-reward levels that reflect the current price variance levels to improve the odds of success.