
When building trading models a common error is to focus mainly on entry signals. Experience told me that exit methodology and sound money management will have far more effect on individual model profitability. Therefore some building blocks need to be established.
Generic exit code should have been tested on the following criteria and should be good enough to be an entry point (For a trend following system, the exit creates a reversal system). Use a Random Entry Generator to test and prevent curve fitting.
Time: How can you ride a trend through to its end? A reversal system will typically have its first peak in performance 15 to 20 bars after entry. There follows a period of back and fill or sideways before a trend can restart.
Do you build a separate system to capture this secondary move?
Do you use a Time-based exit or trailing stop in that 15 to 20 bar window and then create a new pattern (breakout) to catch the secondary move?
Do you raise the timeframe chart (Stochastic Steps)?
A variable look back risk test (Adverse Excursion/Signal Evaluation/Time)
Code must be tested to be dynamic to volatility/range and timeframe to allow for variance in volume and/or risk.
In the series of articles quantifying divergence, the concept was raised of identifying divergence with far more relationships than the tradition and used my Rsi Divergence Study as an example.
The code acts as an exit to a trend following system on Futures and Fx, but with Equities skewed to the upside with periodic downward shocks, the key to its success was whether it could perform in a bear market.
Note how the accuracy peaks between 15 to 25 bars on the S&P 500
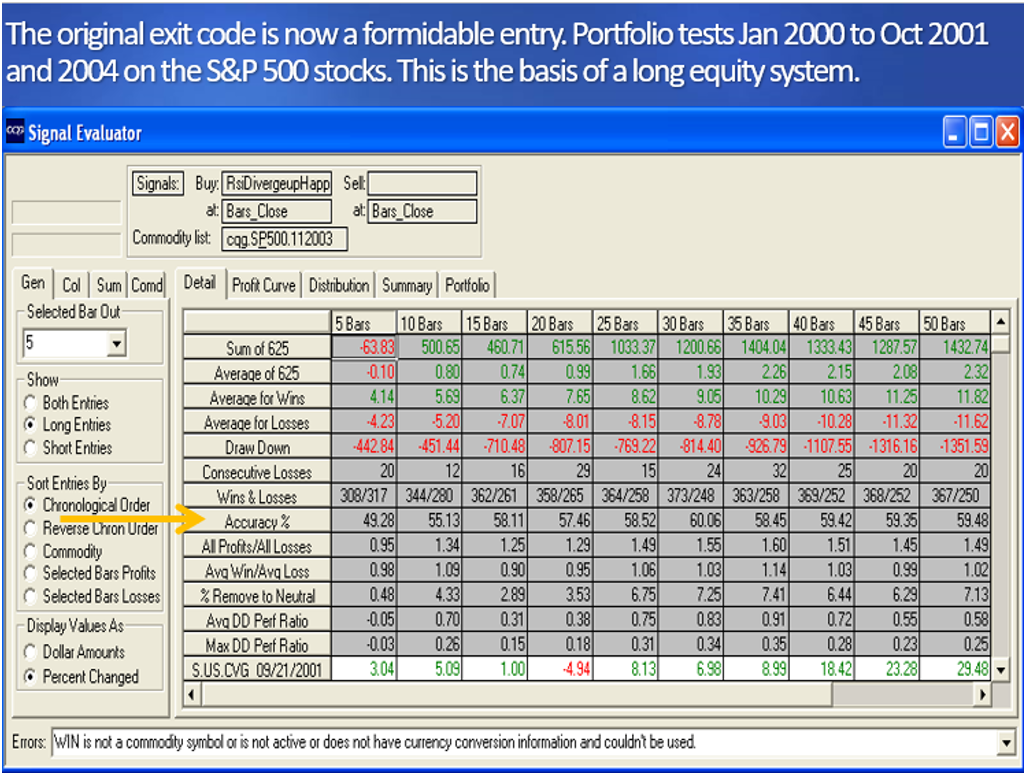
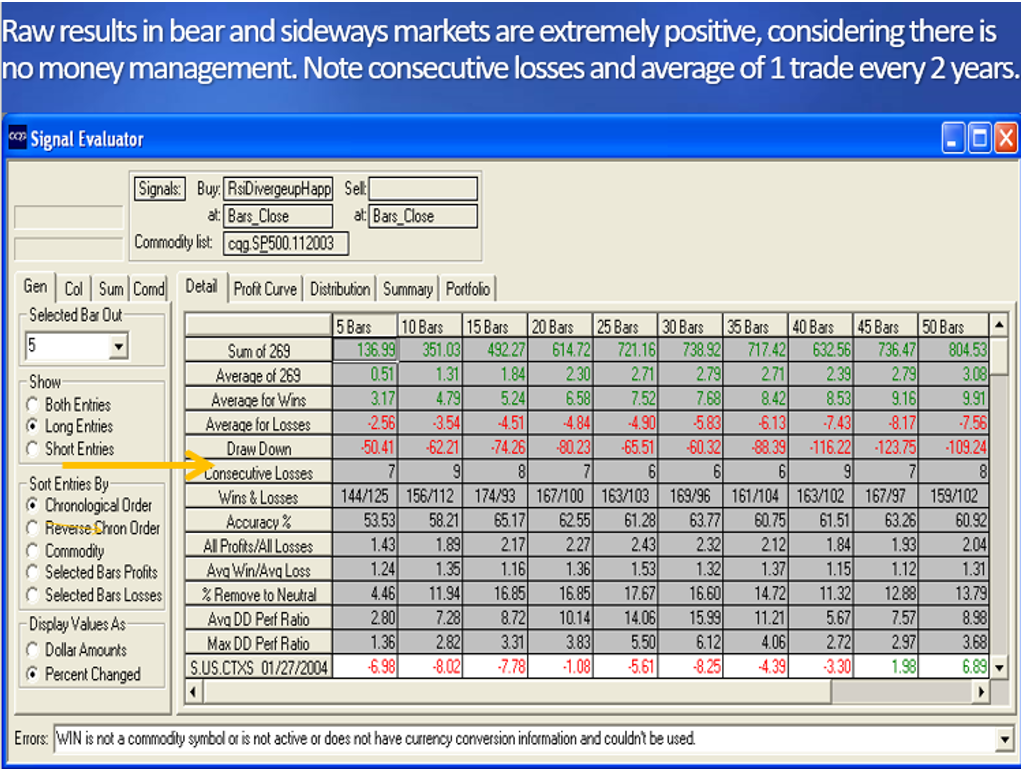
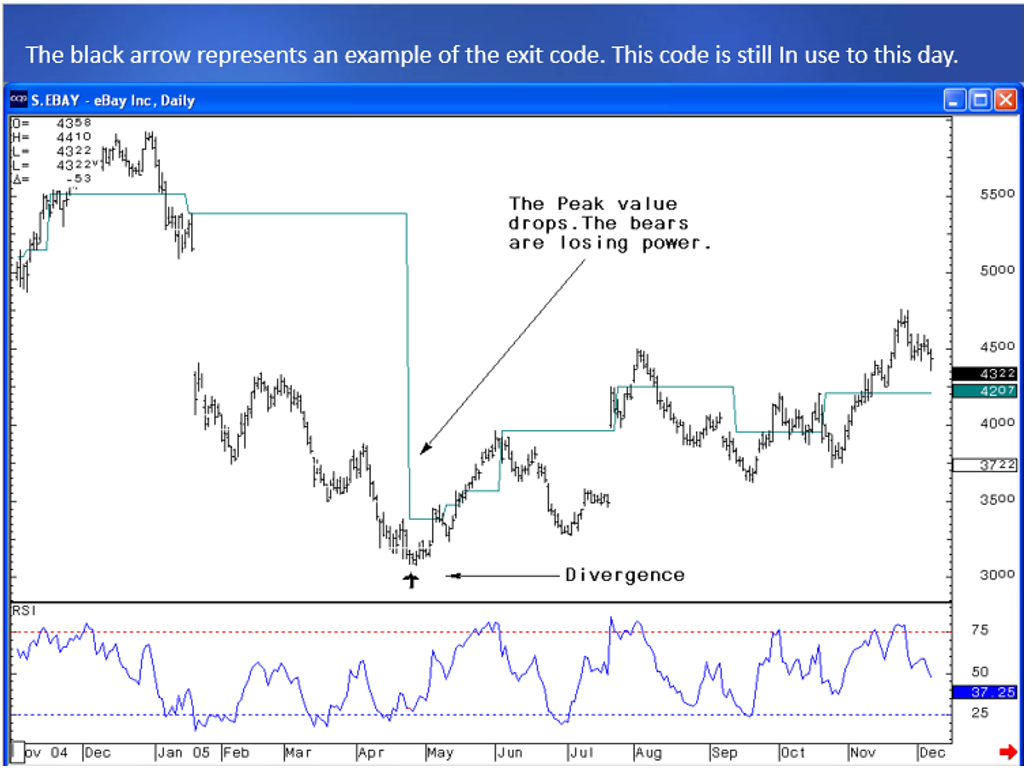
A trading models risk/money management rules are more important than the logic that generates the entry signals and just as important as your code-based exits.
What will be the opening position size of your next trade?
How does the limit of expectation and volume compute?
Where will you set your stop loss (es)? (Adverse Excursion)
Will you use a fixed or adaptive method for the determining the Timeframe chart and will you use pyramiding techniques? (Range Deviation Pivots)
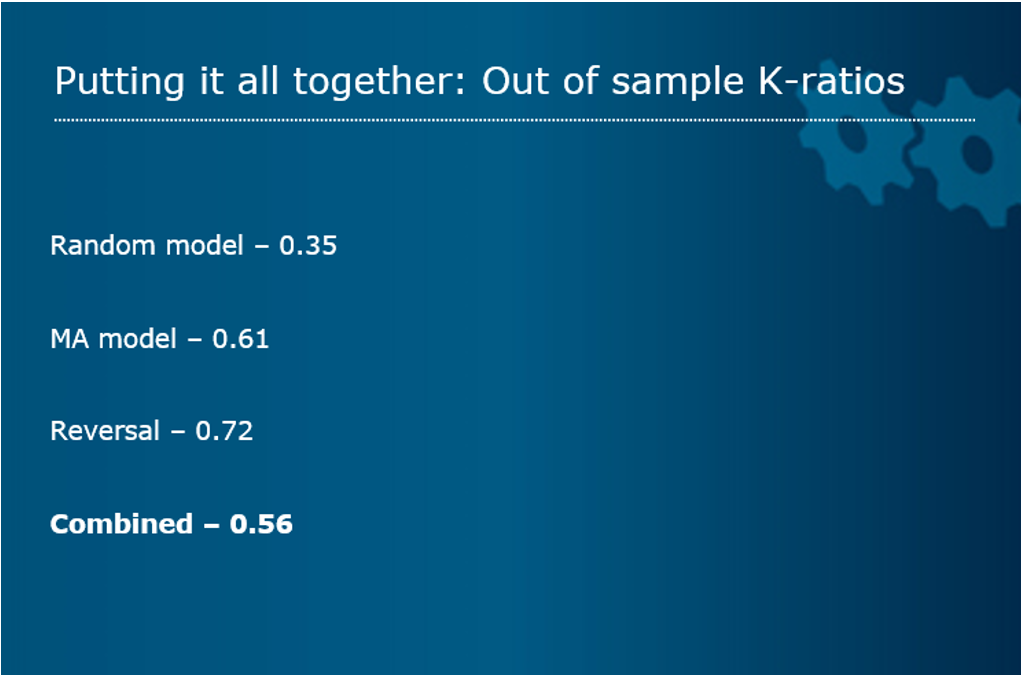
In order to gain an understanding of risk management I have taken three very simple systems: Random, Trend Following and Reversal. The objective is to get a K-Ratio greater than 0.5.
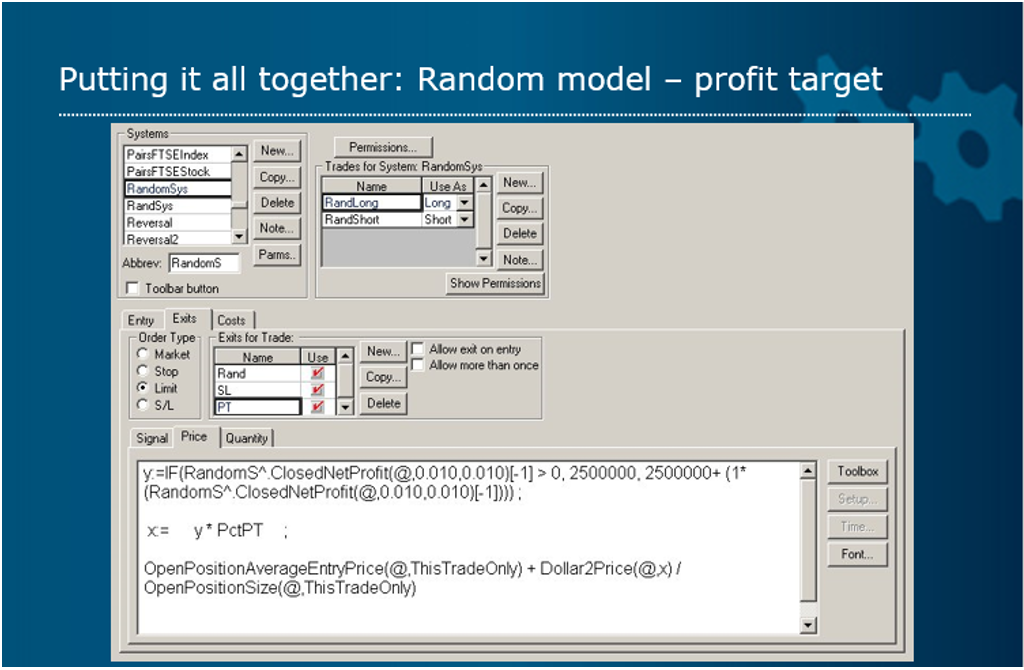
The Random Entry Generator creates a long signal on number between 1 and 4, does noting if 5 and a short signal between 6 and 9.
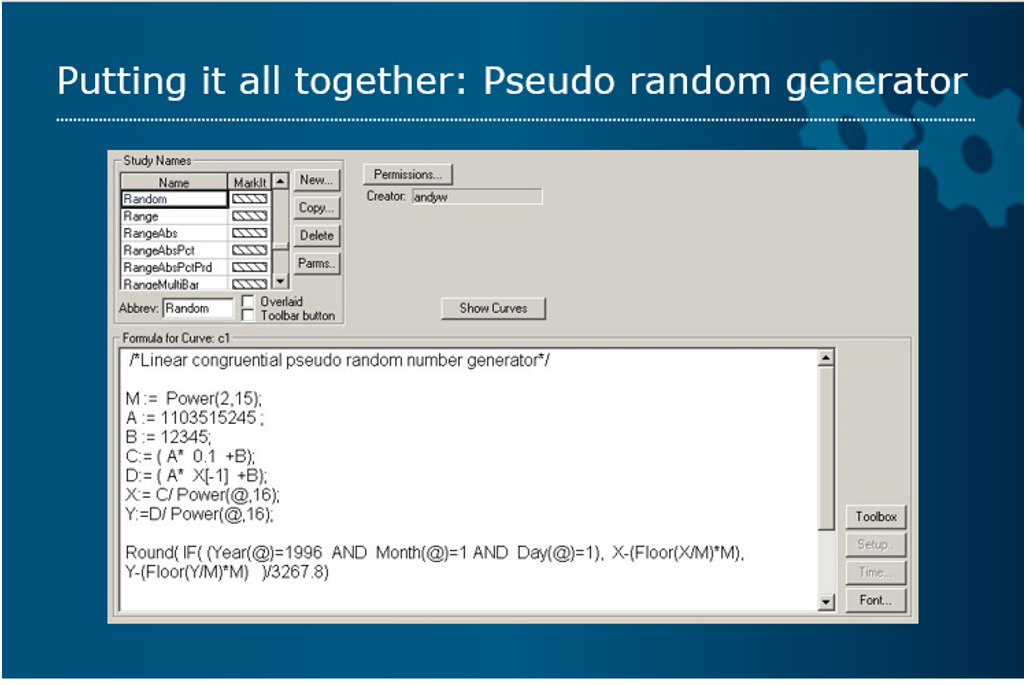
Applying it Spot Fx for simplicity's sake, if the previous trade was a loss, it lowers the position size by the corresponding amount.
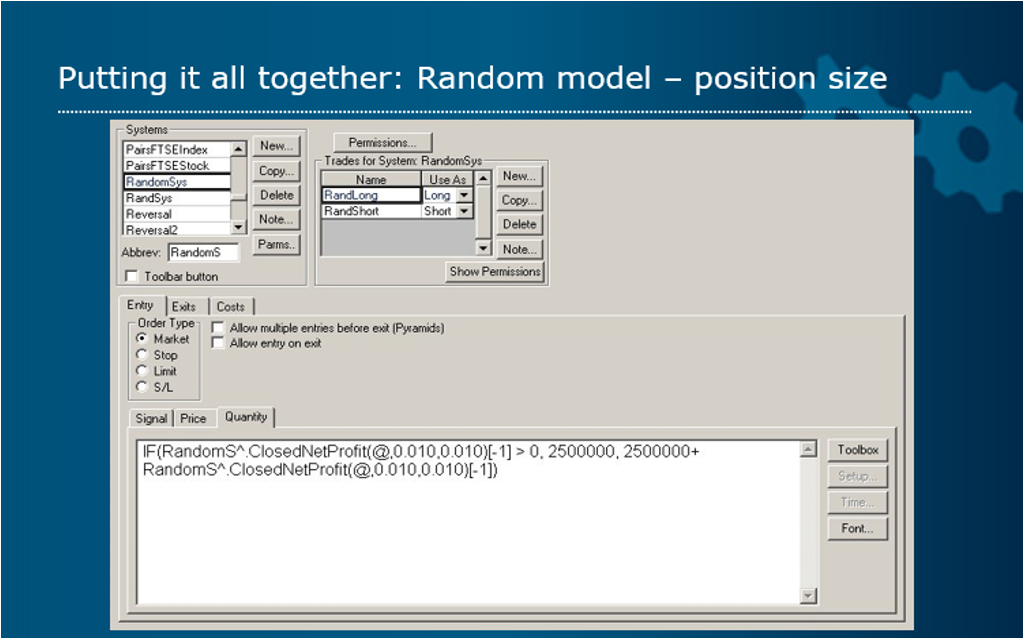
It applies a percentage profit target of 2% and is the same for the stop loss which is used so as to skew the results down as adverse excursion analysis will provide a tighter stop. The reversal system would also exit the trade.
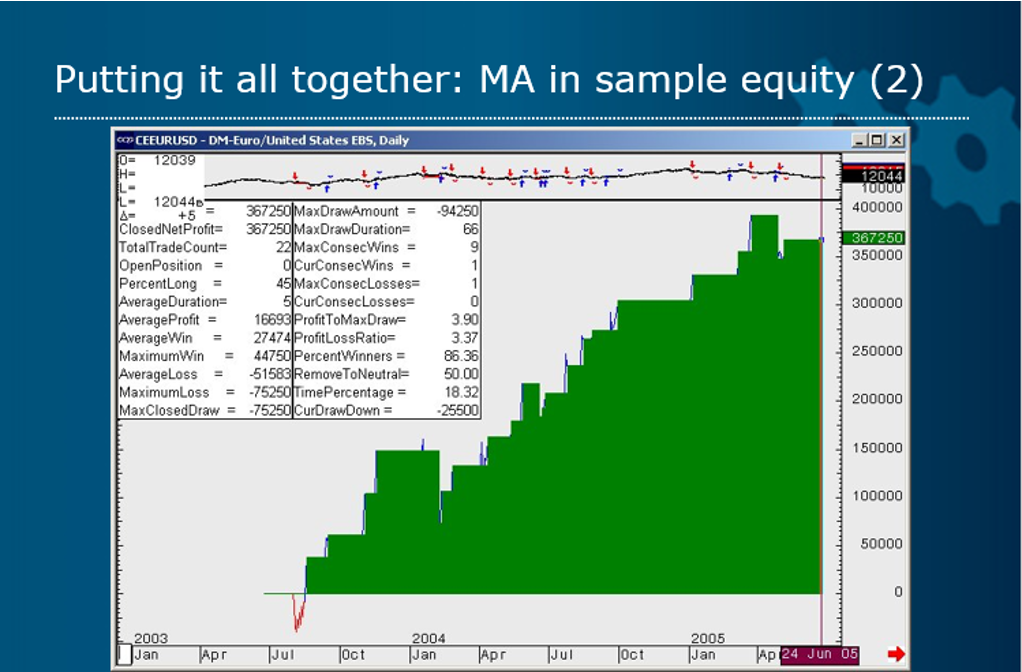
The trend following system is just a Moving Average Crossover. Long Entries 10/21 average Short Entries 6/12 so as not be always in a trade.

No surprise that the results are horrid in terms of stability and drawdowns.
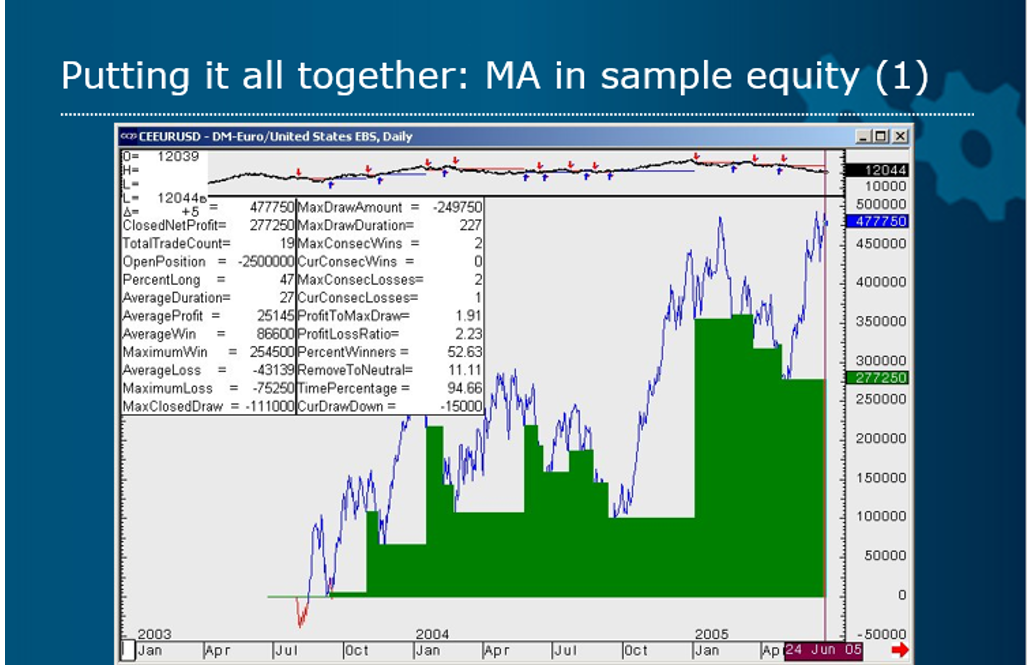
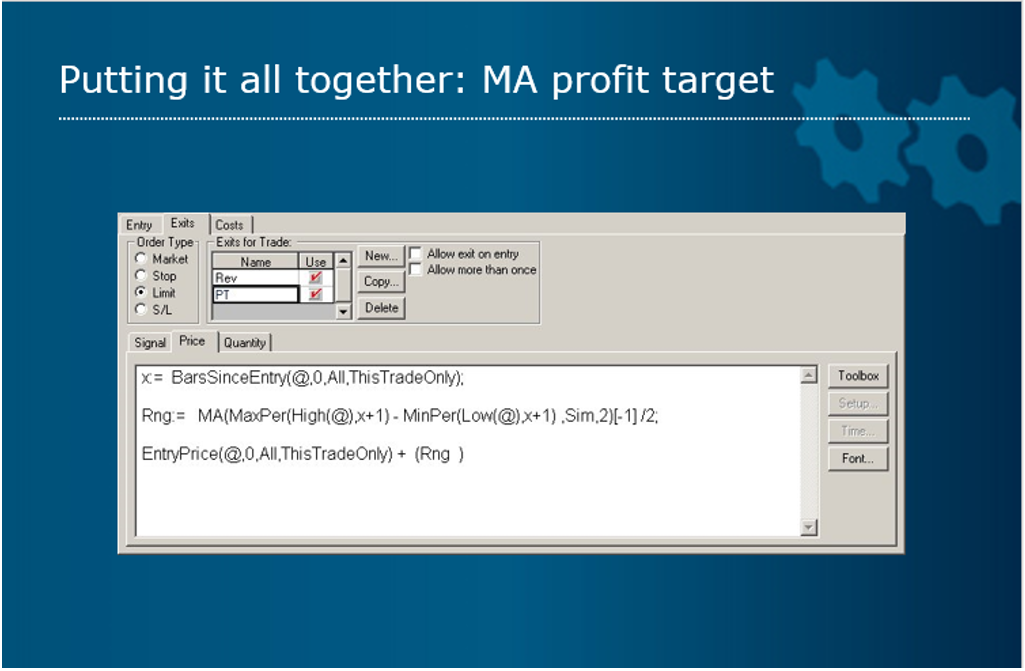
However adding a simple range/time profit target mechanism improves the results considerably. It takes half of the range since the trade began and adds it for a long position to the entry price.
Max drawdown has dropped significantly.
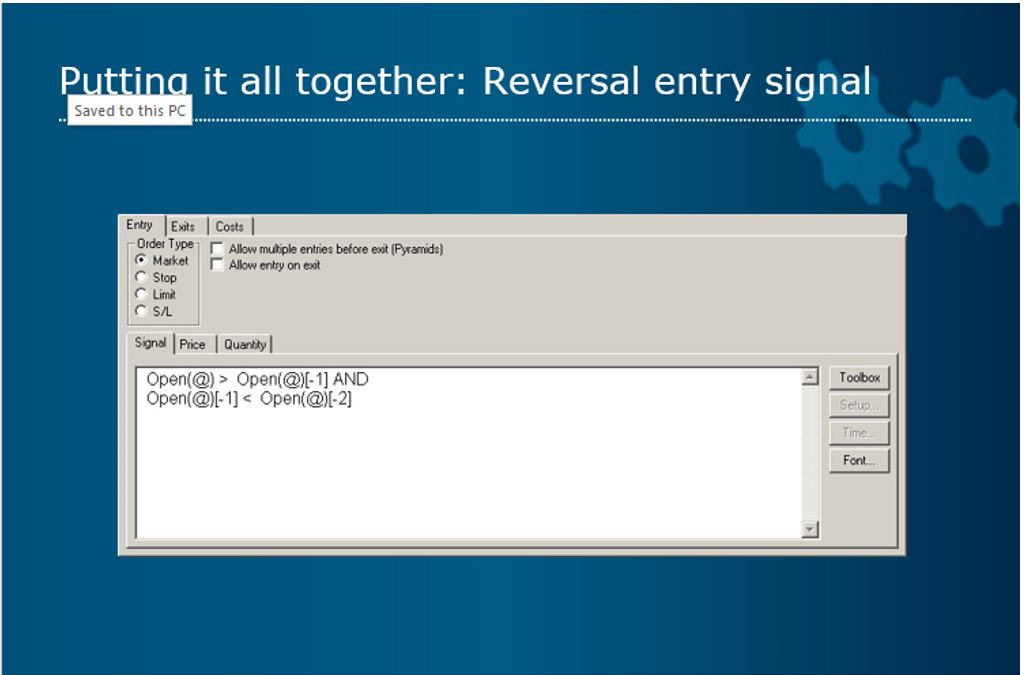
The reversal system entry logic is very poor. On longs price simply made a 3-bar low and reversed and uses the original risk logic as the Moving Average. The trade only lasts 1-day as the reversal logic entry is so poor.
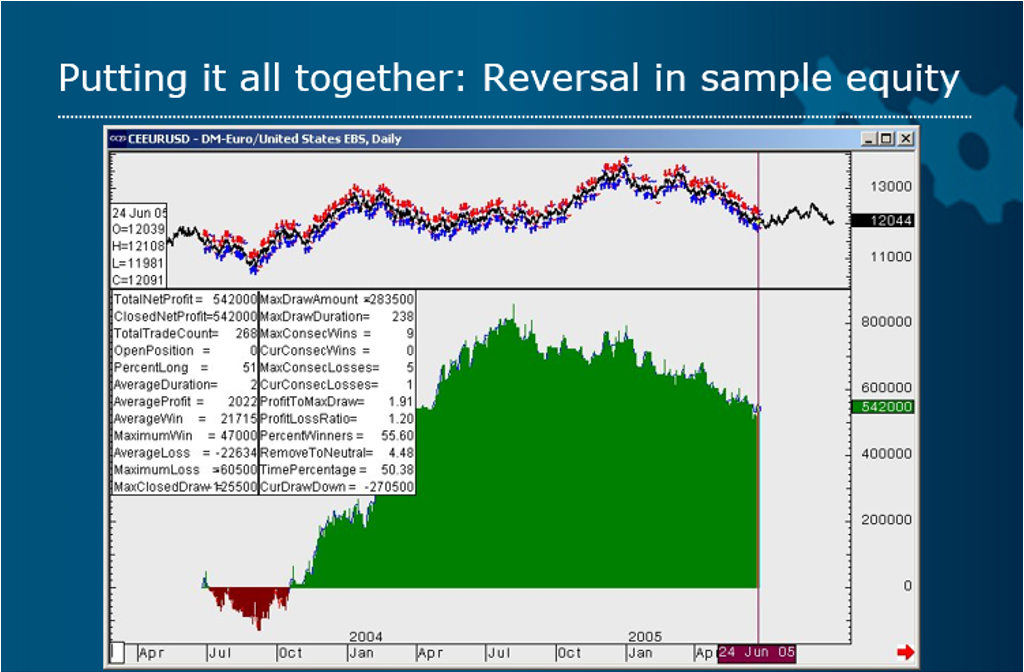
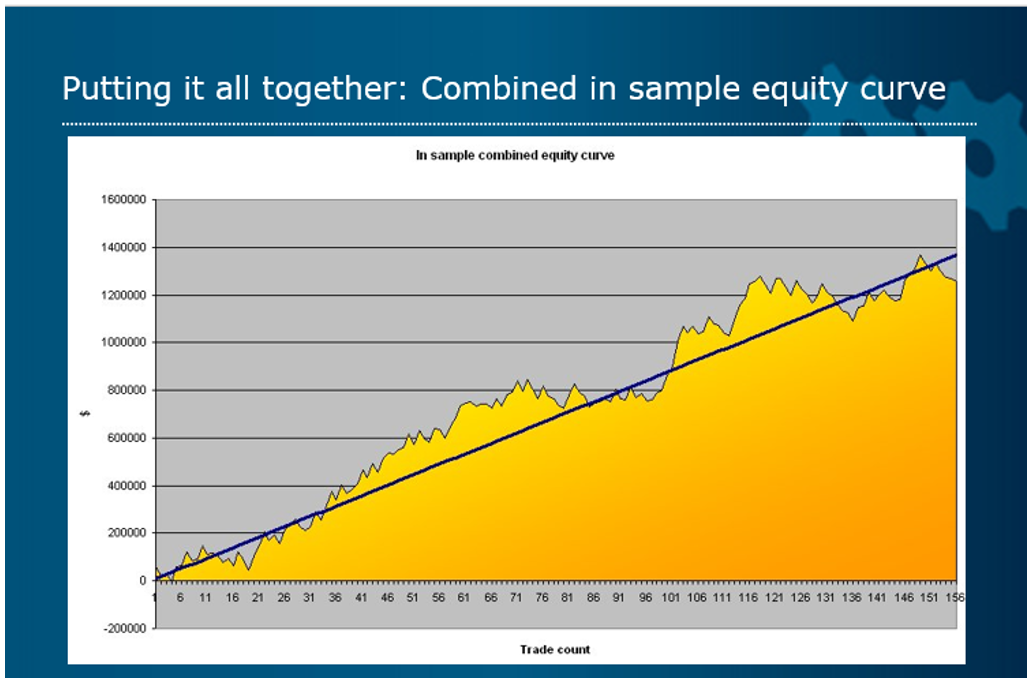
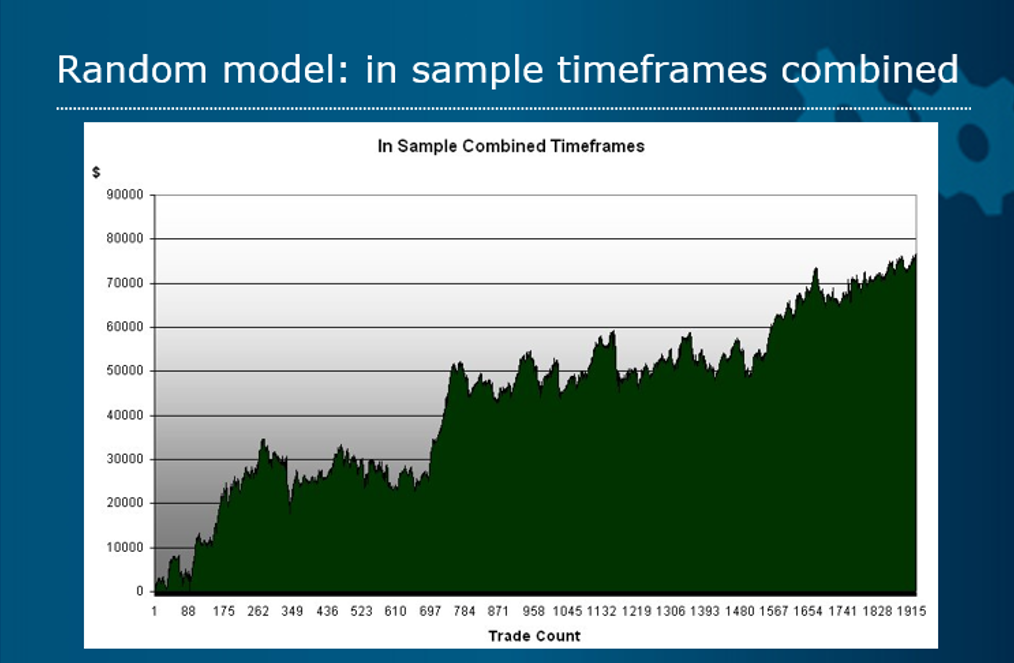
When analysed in combination the equity curve is ok.
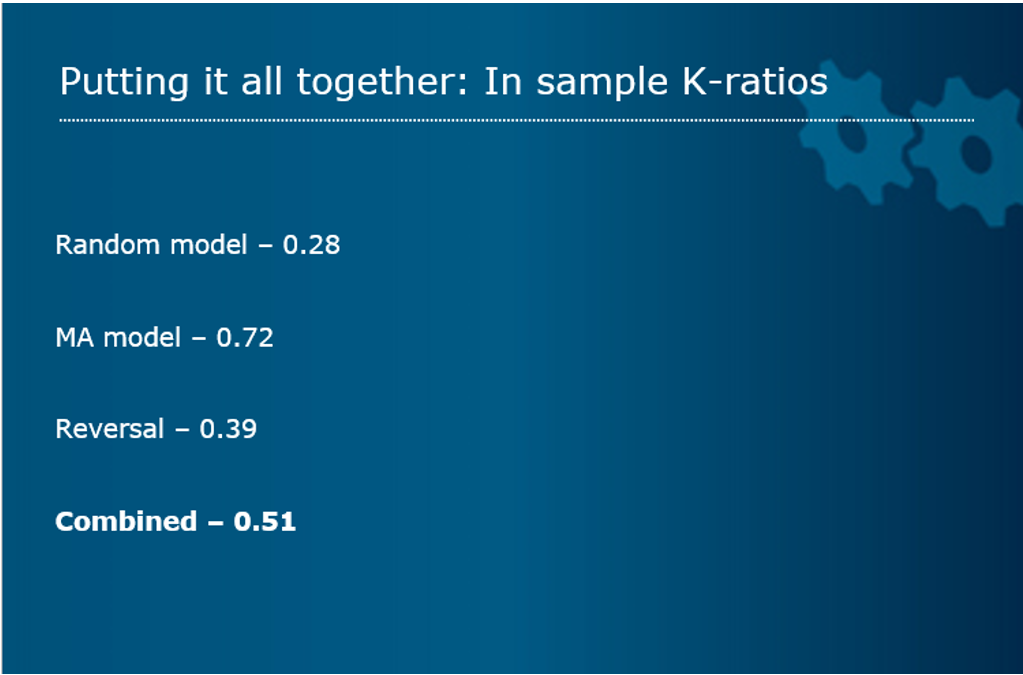
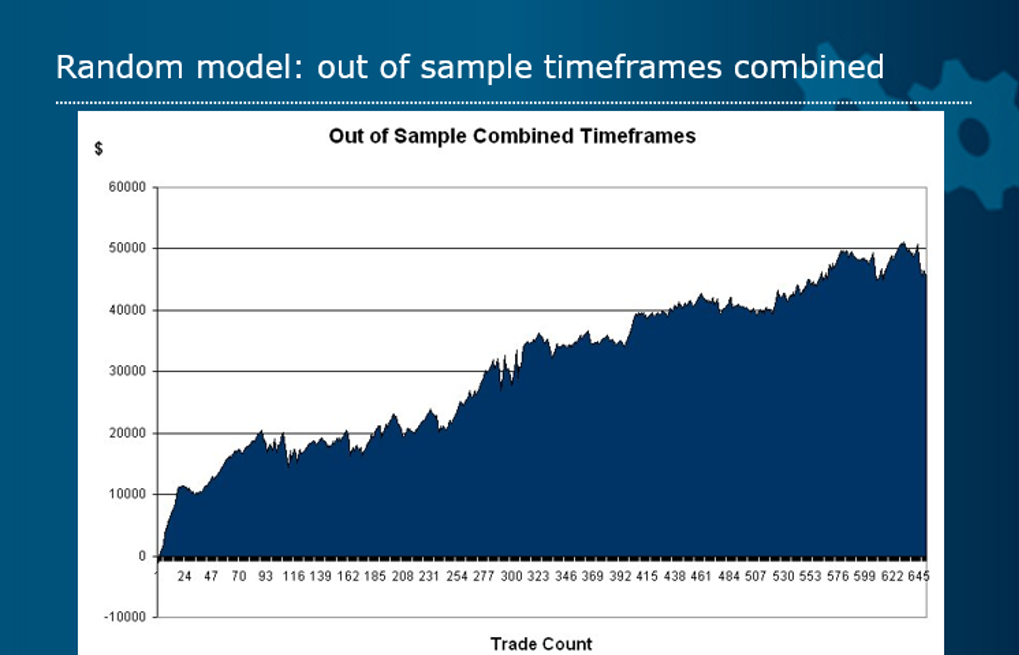
Next are the out of sample tests.
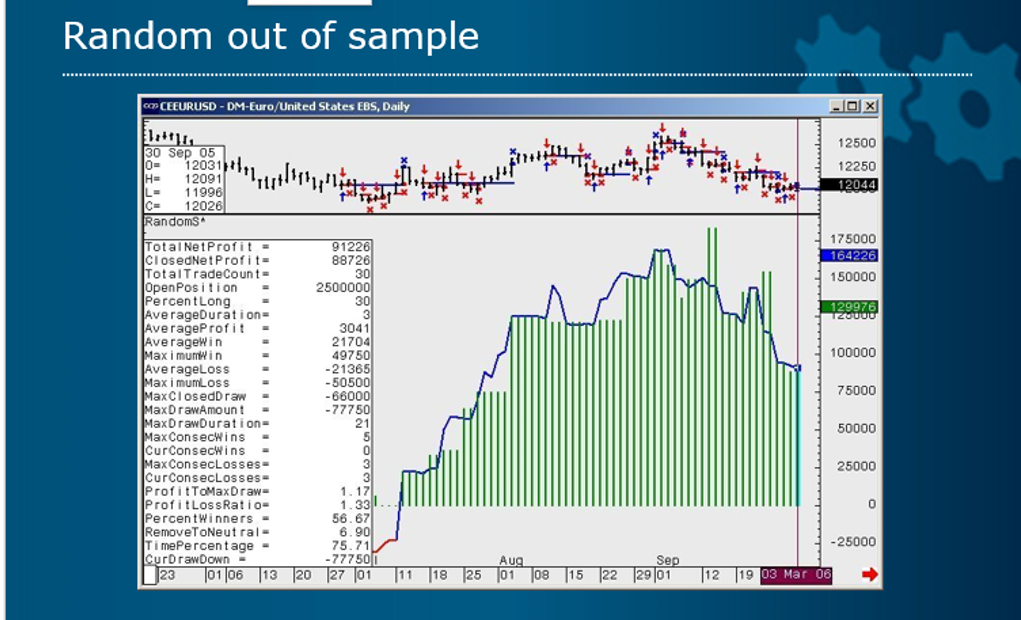
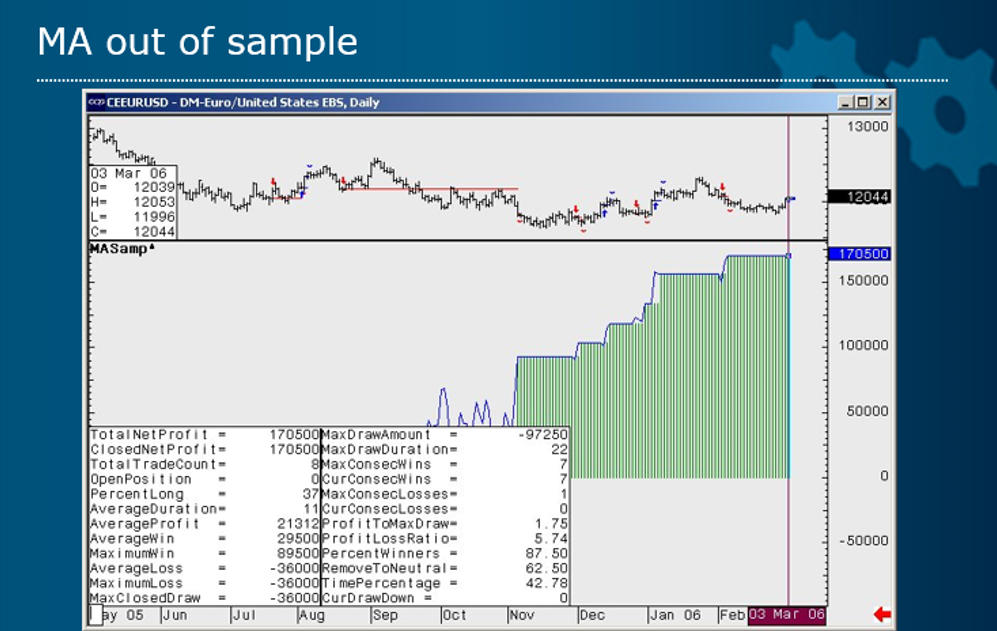
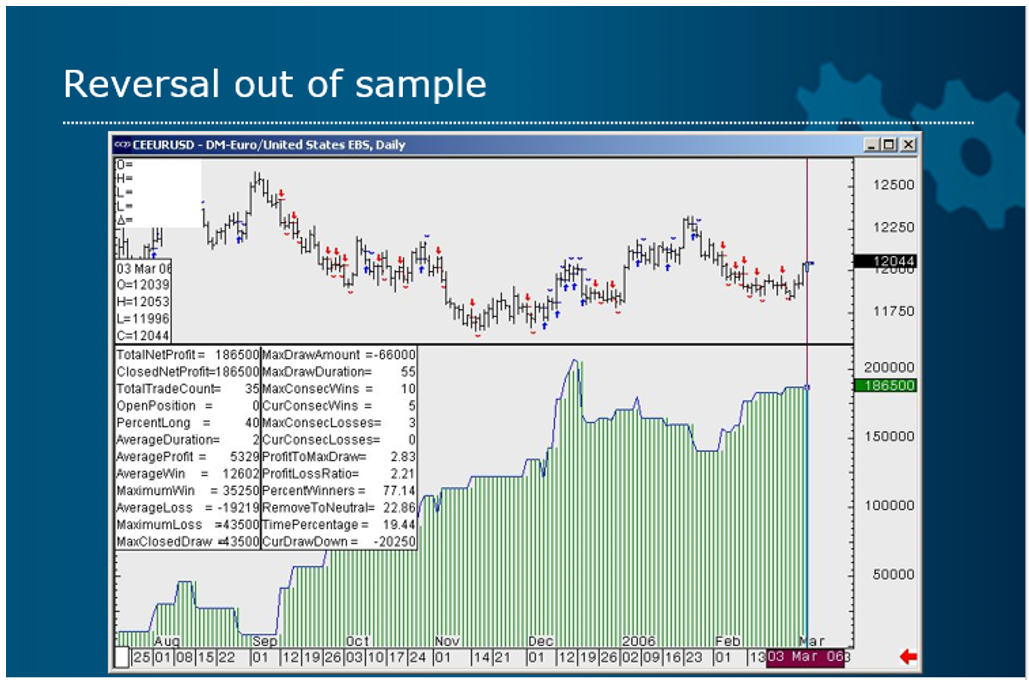
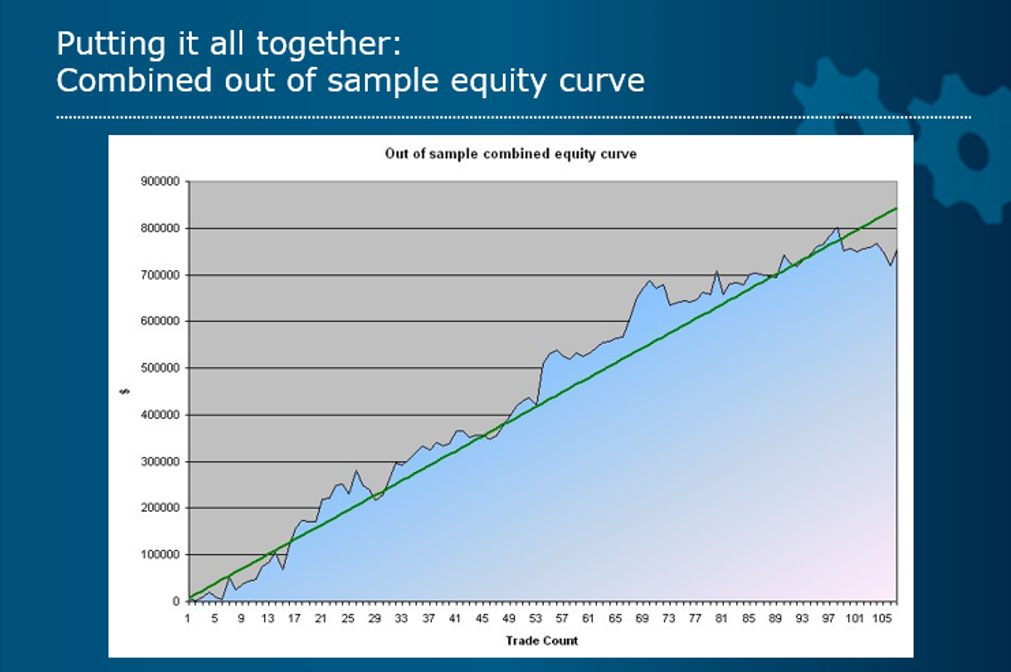
The out of sample tests are better which means curve fitting has likely been avoided.
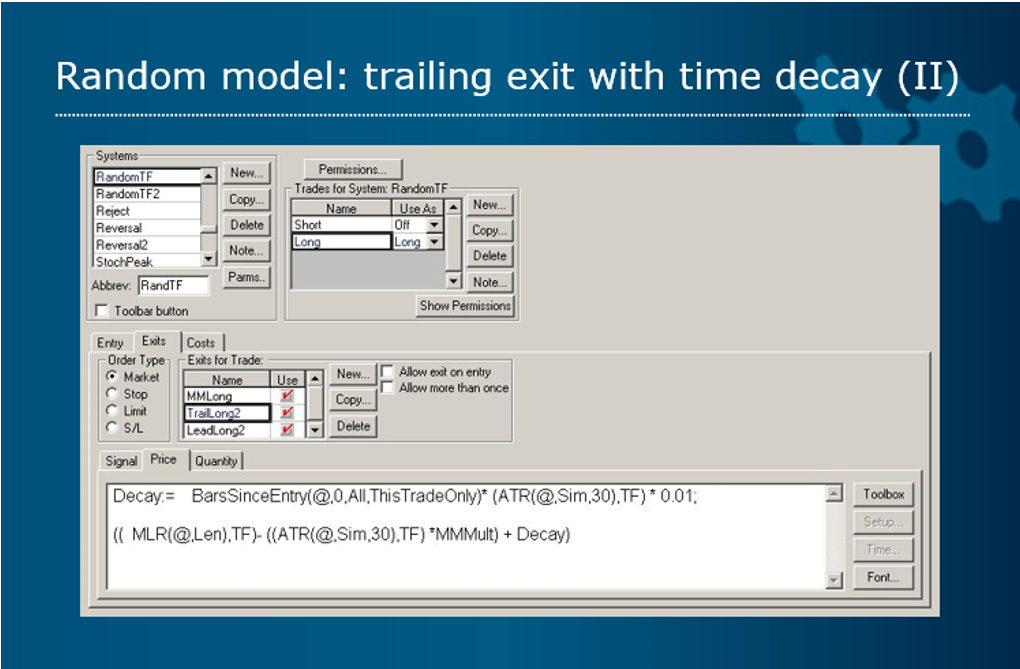
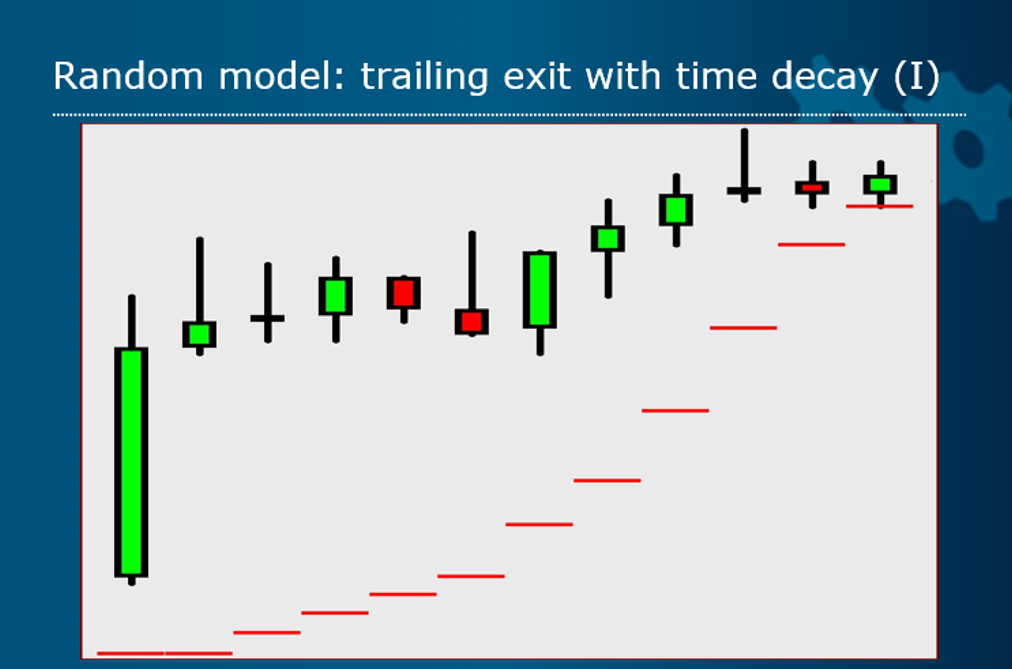
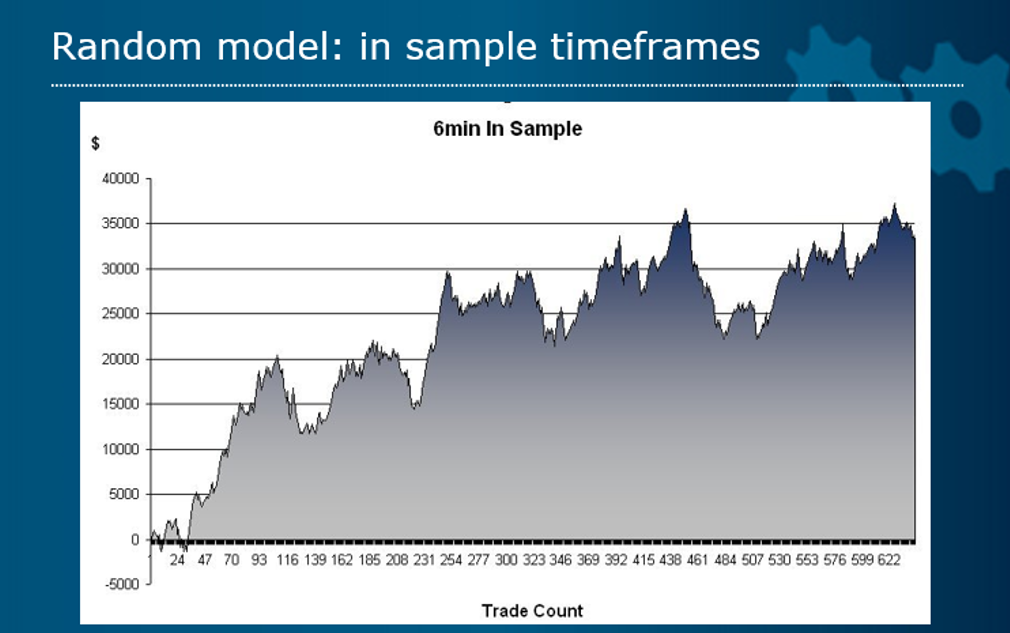
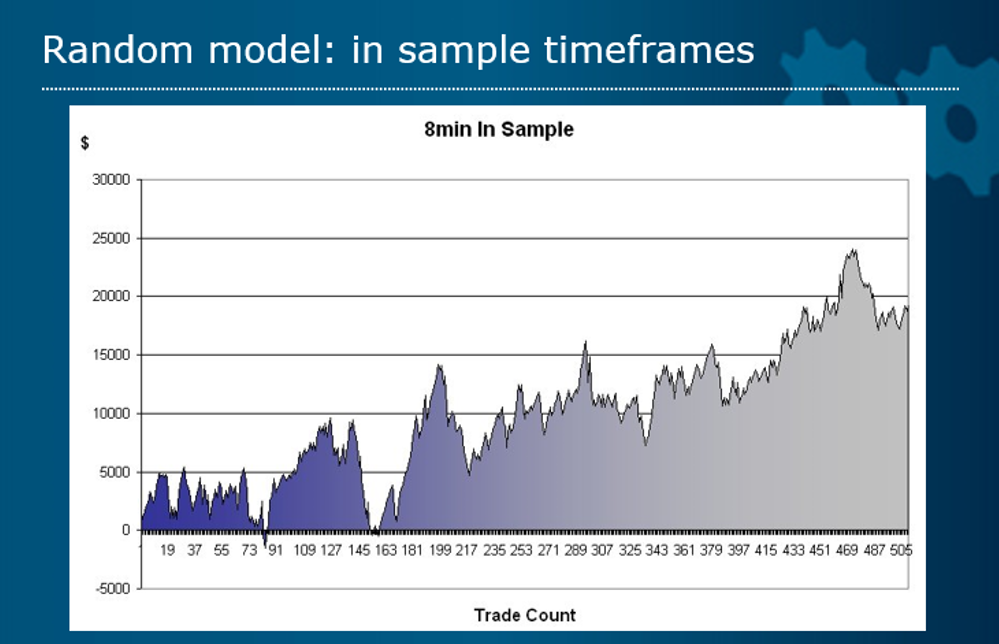
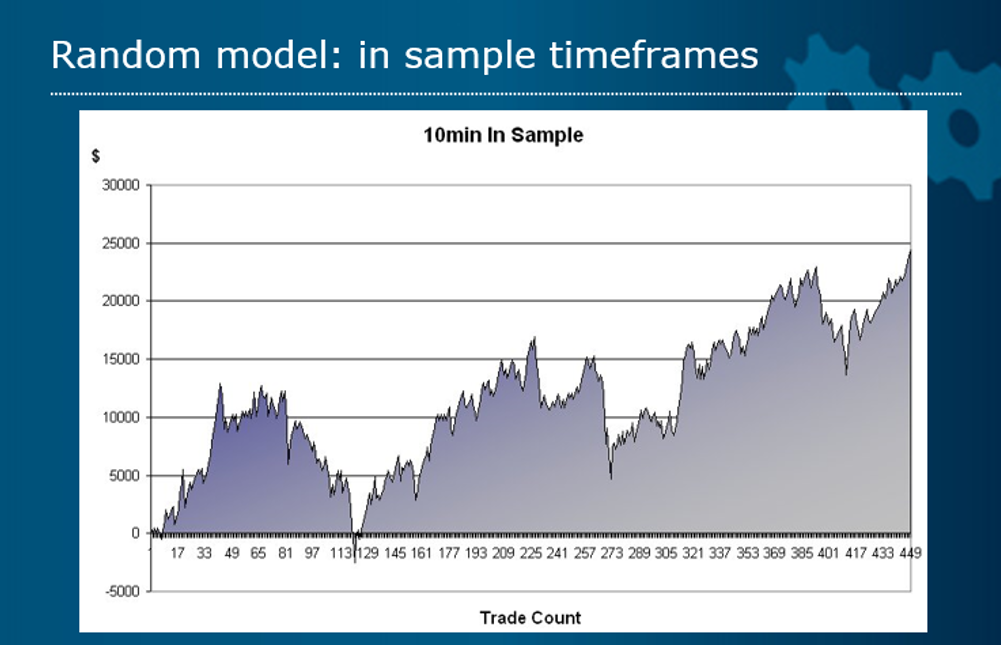
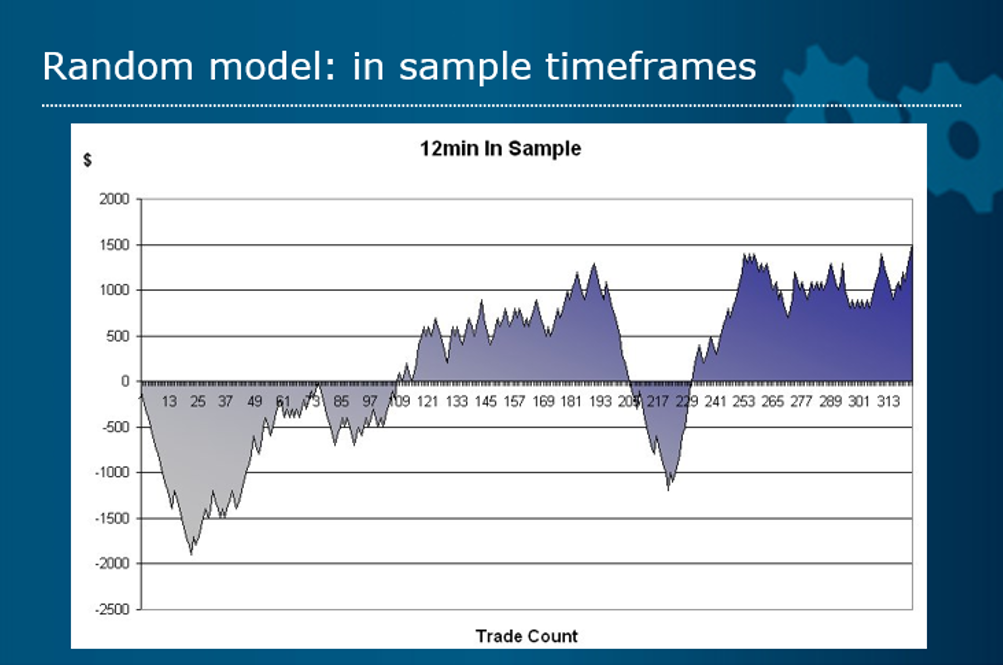
In the next set of tests I have reversed the entry logic of the Random system and placed it through multiple timeframes. Expanding on the Moving Average systems exit that was based on Range, I have taken it a step further. Armed with the knowledge that trends typically last between 15 and 20 bars I have linked a Parabolic type of logic using range from the entry point that accelerates the trailing stop as time progresses. This is a very useful concept if not moving timeframes up through Stochastic Steps.
The model is on Fx and can only trade between 6am and 6pm U.K. time for liquidity purposes.
Out of Sample
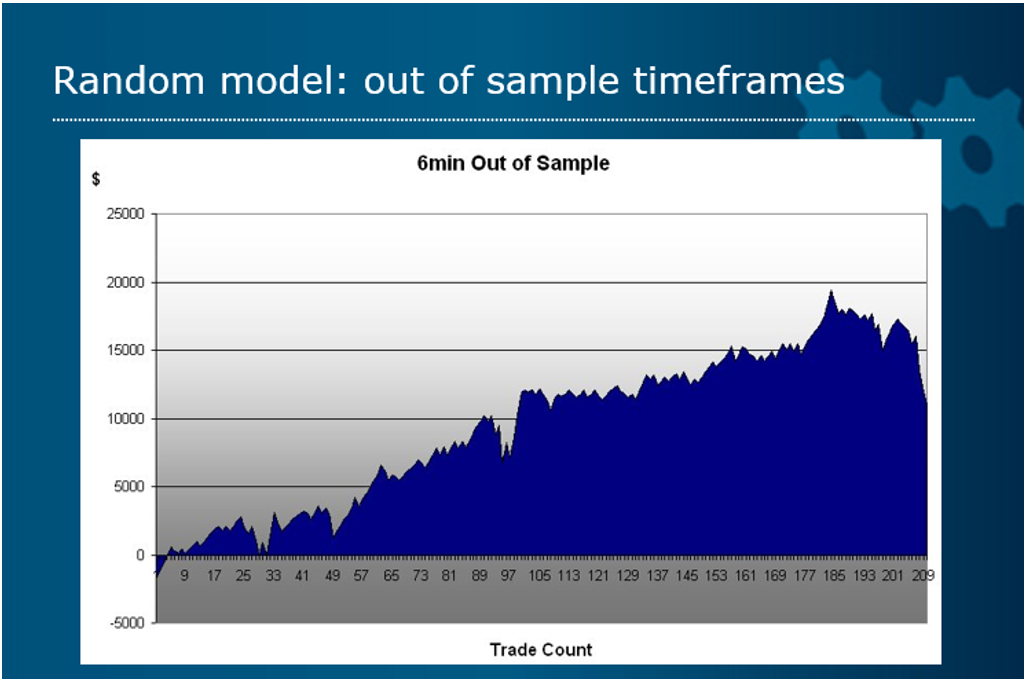
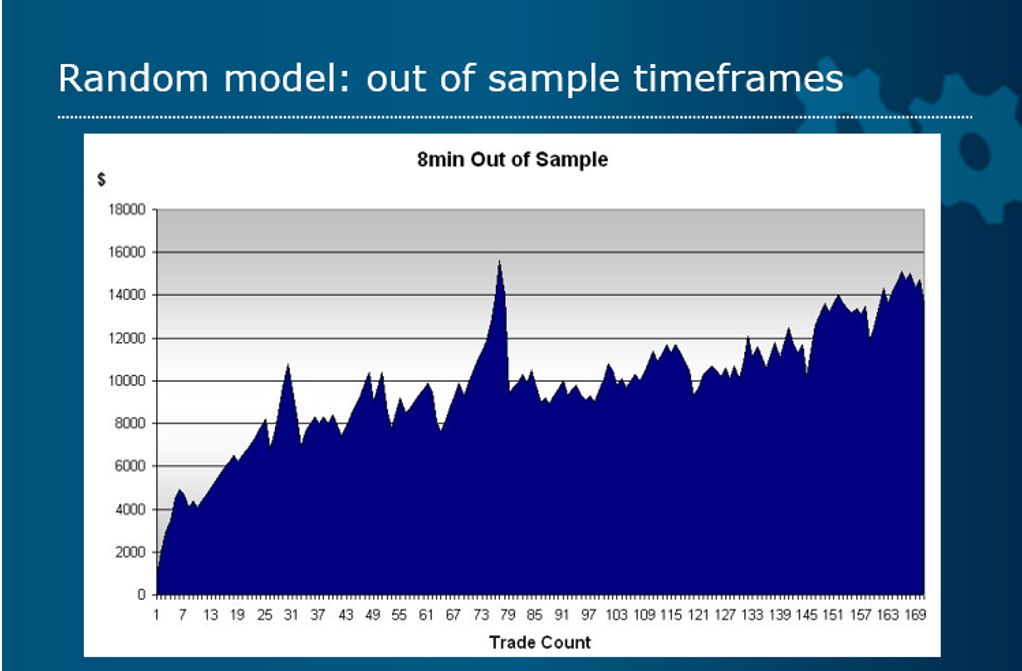
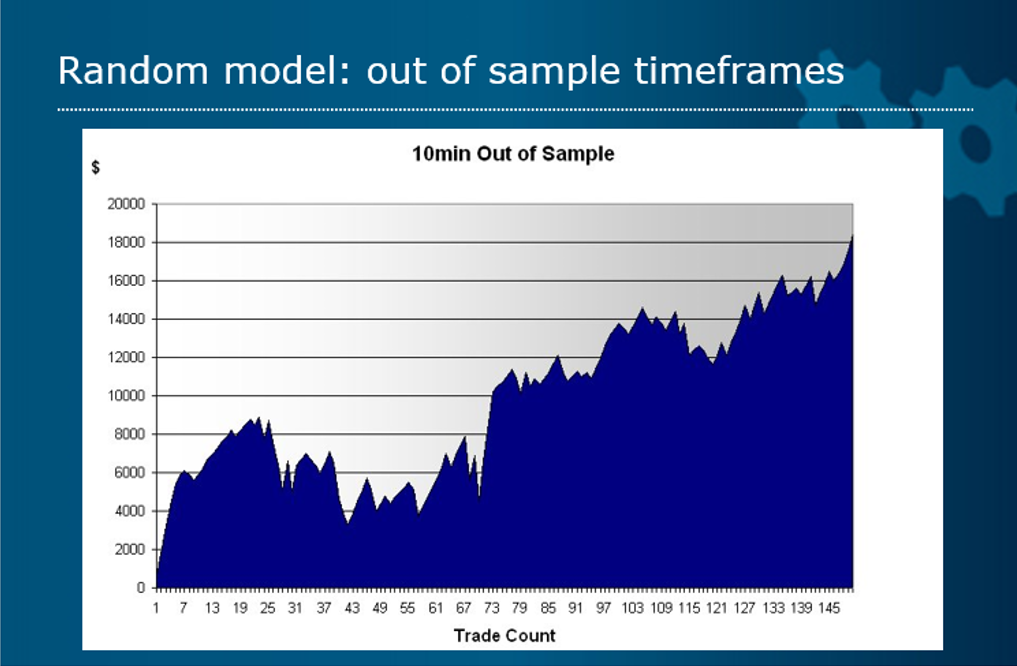
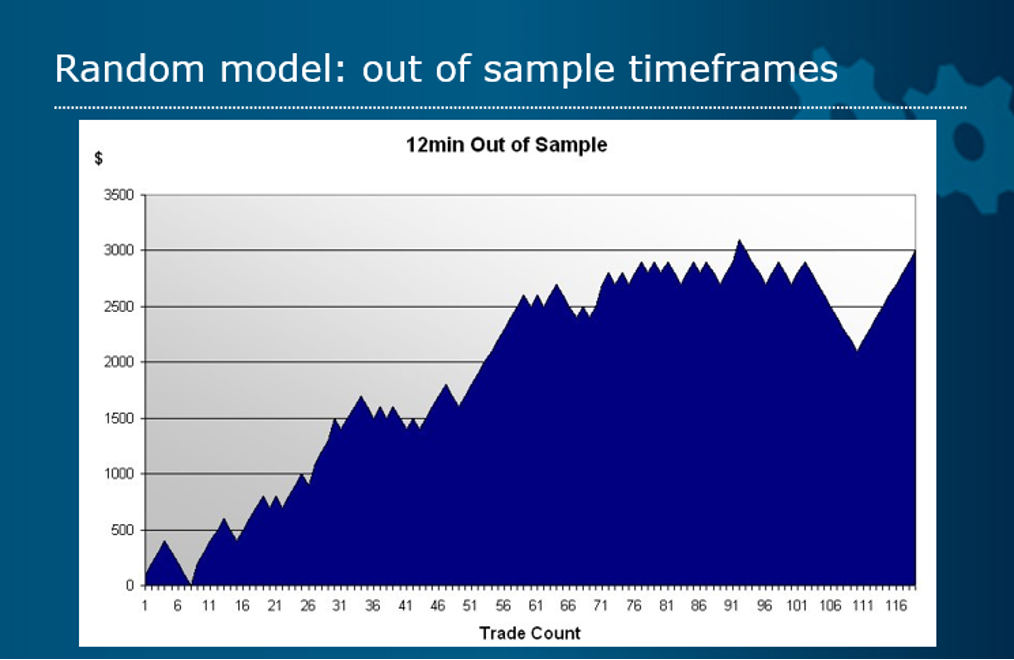
Taking them in combination, out of sample in this case was worse, but both had low drawdown periods.
Next time we will look at Minimum and Maximum Adverse Excursion plus the Building Blocks for Optimization, and revisit Step Theory of Timeframes and Range Deviation Pyramiding.
