Today's traders and analysts simultaneously track many different markets within the same or different asset classes, looking for markets that may be at extreme price levels relative to other markets. Those markets that are at extremes may be tradable opportunities or may offer insight into the general conditions of asset classes.
One way to more efficiently identify markets at extremes is to use heat mapping with quote displays. Excel® offers heat mapping as an option for conditionally formatting cells.
This first image has two quote displays. The top quote display shows sovereign debt yield spreads. Country flags run diagonally across the quote display. Above the flags are the 2-year yield spreads. Below the flags are the 10-year yield spreads.
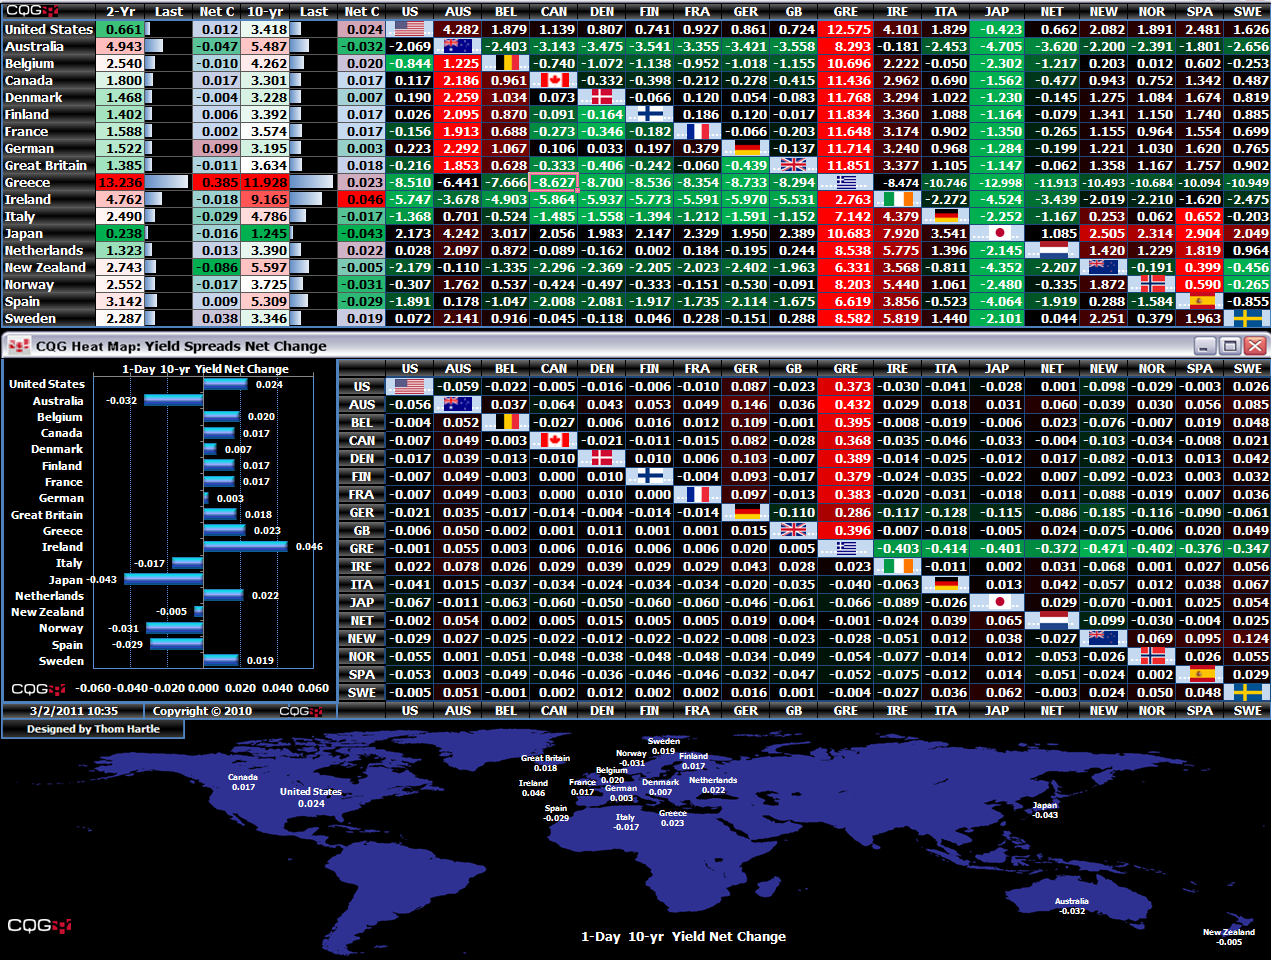
The bottom quote window displays net change for the day for 2-year and 10-year yield spreads.
In the top quote display, the matrix with the flags is heat mapped by row. You can quickly see that the interest rates for Greece, which are bright red, are much higher spread rates to the rest of the countries. At the other extreme, Japanese interest rates are at a significant discount and are bright green.
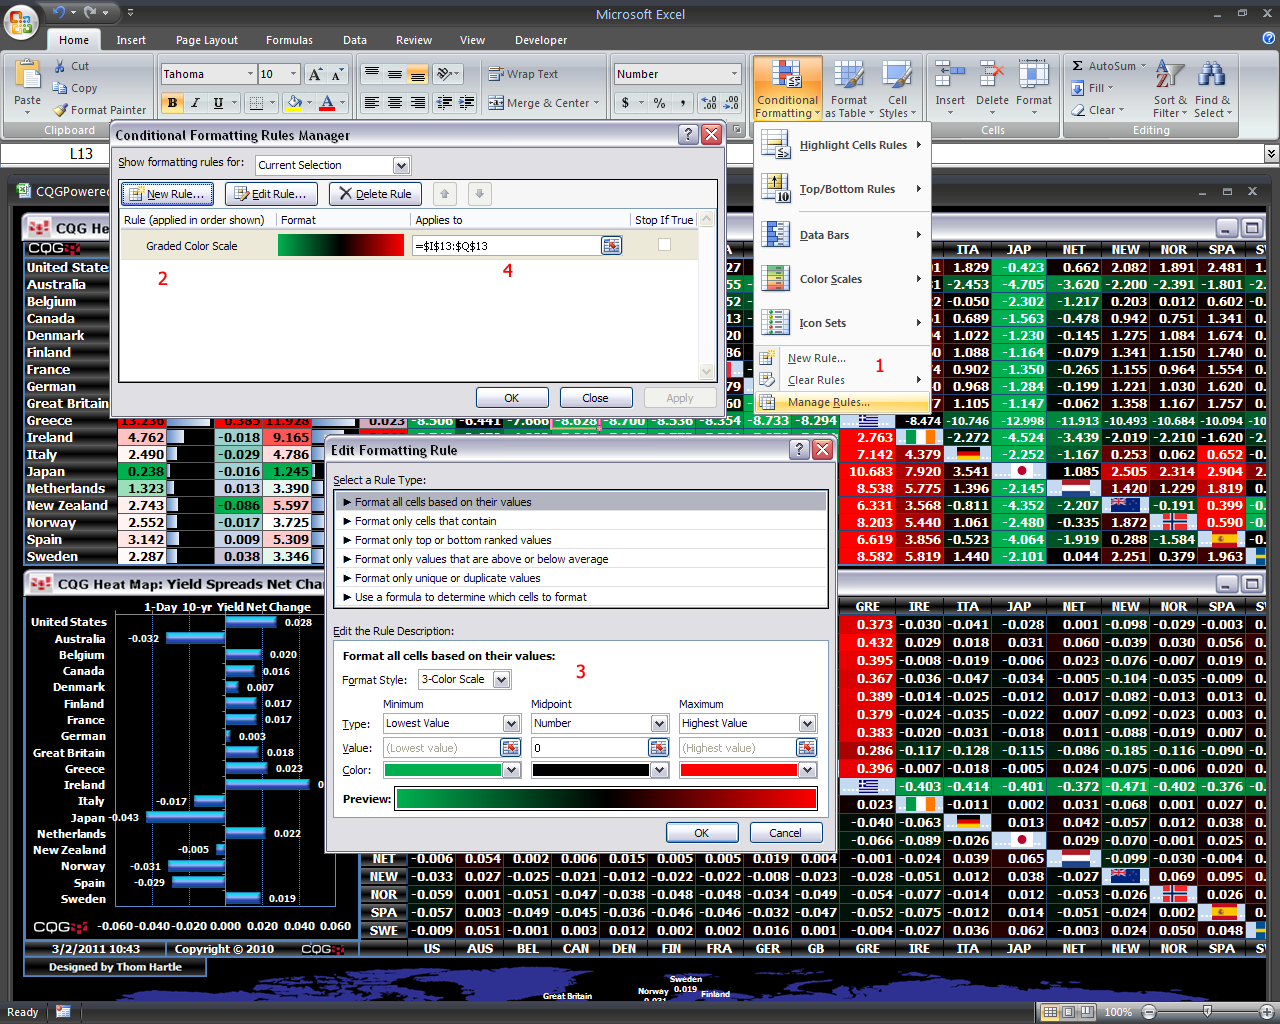
To set up heat mapping:
- Click the Conditional Formatting preferences under the Home tab of the Excel Ribbon. There are a number of conditional formatting techniques available.
- Select Manage Rules.
- Select New Rule.
- Select 3-Color Scale. Because these are prices in yield, minimum numbers are set to green and maximum numbers are set to red.
- Click OK.
- In the Applies to window, select the cell range for heat mapping.
This image shows the steps to set up heat mapping.
Excel offers a number of features that make information more readily understandable. I will be exploring more of these features in future postings.