CQG Has Added A Volume Dimension To Candlestick Charts
Ever since Charles Dow started theorising on markets, volume has been seen to be an important confirming factor to the prevailing price action, providing additional colour to the two dimensional study of price and time. Candlestick charting also values the addition of volume when discerning levels of supply and demand. The problem for the market practitioner using candlesticks has always been in integrating volume effectively into their analysis. Candlestick charts are plotted independent of volume so the closest most have been able to get is to simply view volume as an indicator plotted on the same chart.
The problem for the market practitioner using candlesticks has always been in integrating volume effectively into their analysis.
It is with this in mind that CQG has introduced Volume Candlestick charts. Volume Candlestick charts are created in the traditional way using open, high, low and close data but with the addition of a volume component that determines the width of the candlestick. The greater the volume, the wider the candlestick. This brings a whole new 'look' and readability to candlestick charts and will be a useful tool for any trader who believes that volume is a key metric for market analysis.
Volume Candlesticks In Practice
Note the width of the candle at point A on the chart in Figure 1, clearly indicating that the breakout of the recent consolidation pattern is being associated with a sharp increase in volume. Bearing in mind the upswing is in-line with the prevailing trend, the volume candlestick chart does a good job in highlighting what proves to be a decent opportunity to join the move.
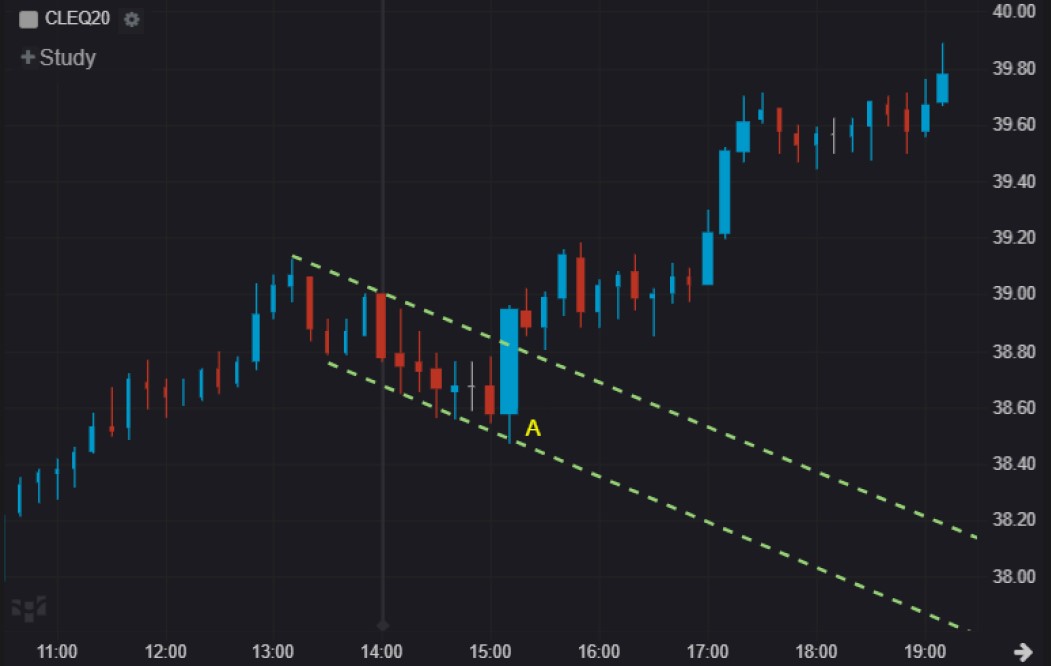
Figure 1: August WTI, 10 minute chart
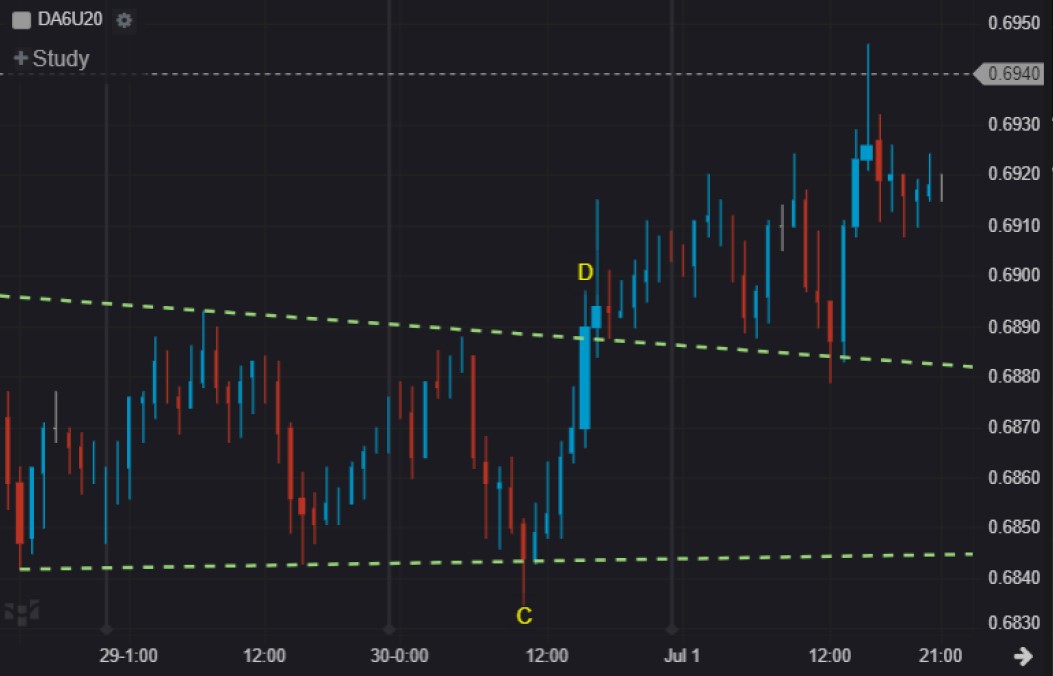
Figure 2: AUS/USD Futures, 5 minute chart
Volume candles can also warn of times when it is best not to trade. Note the series of thin (low volume) red bars on the swing down to point C which culminate in a false downside breakout in the AUS/USD future. Interesting to compare that with the thicker upside candle at point D which does breakout of the nearby the consolidation, ultimately proving itself to be the starting point for a more exaggerated upside swing.
The Volume Candlestick is now available as a designated chart type on CQG Desktop. If you are interested in working with this tool or would like to have a discussion about any of our other products please do get in touch.