This article examines how technical analysis can aid in trading around news events. One of the biggest misconceptions is that technical analysis is a “standalone” method and therefore, incompatible with fundamental analysis. How do I combine the technicals and fundamentals? In general, I look for situations in which the fundamental news is contrary to the longer-term technical picture of the market.
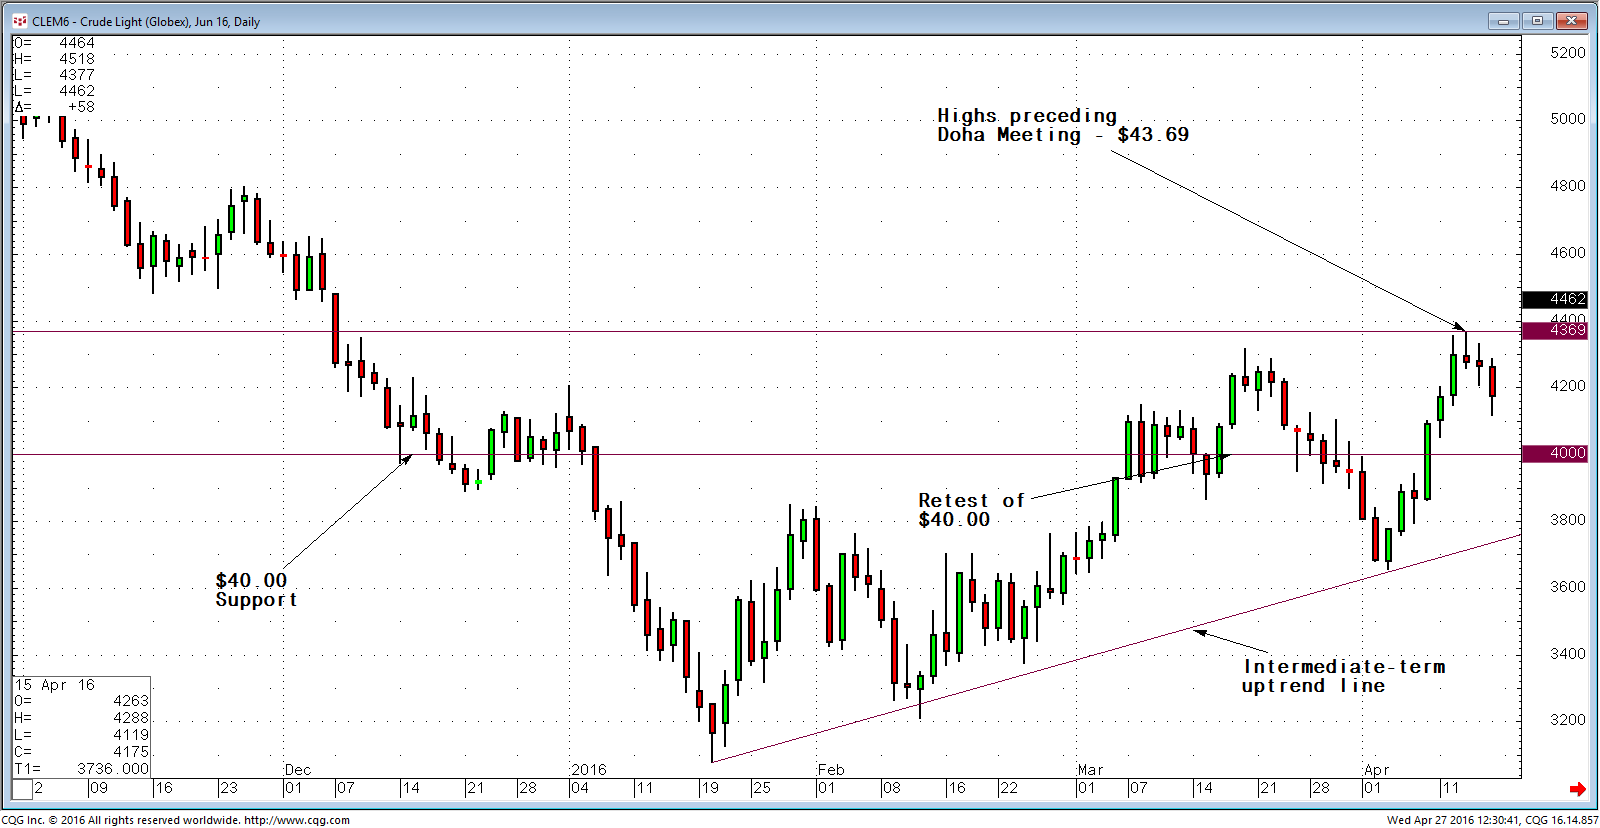
A great example of this occurred in the wake of the April 17, 2016, Doha meeting. First things first, the daily CME Group June 2016 WTI futures chart (see Figure 1 below) shows a good intermediate-term uptrend line drawn from the January lows. Also, we can see the $40/bbl area has been serving as solid intermediate-term support.

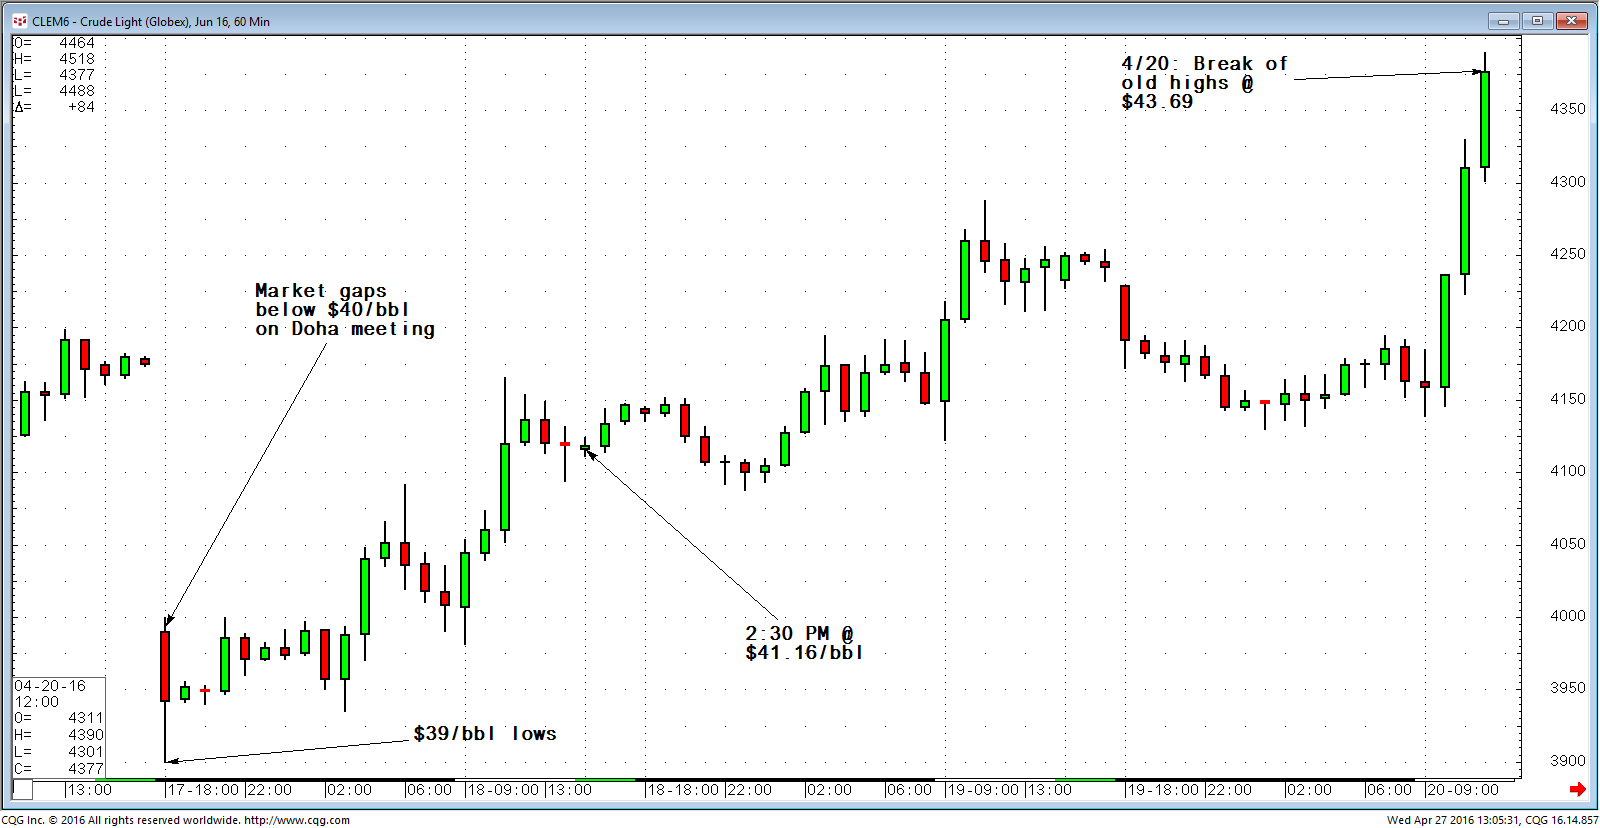
On the open of Sunday, April 17, the market reacted to the bearish news out of Qatar and immediately broke through the intermediate-term support at $40/bbl (see Figure 2 – hourly WTI chart below). There are several different ways of playing this bearish news event. First, the most aggressive approach is with a limit order to buy $40/bbl on the Sunday night open (this order would actually be filled on the open at $39.90). The more conservative approach is to place a buy stop limit at $40.01/bbl so that we’d only buy if the market were strong enough to break $40.00 after the decline on the open (this order would have filled at 4 a.m. EST). The most conservative approach is buy at the market after a close above $40/bbl; this approach would have bought the market at 2:30 EST, but the fill price would have been $41.16.
Next, how do we manage our long position after entry? First, the stop-loss order could be placed just below the intermediate-term uptrend line shown in Figure 1. That stated, once we close above $40/bbl, we could reduce risk by raising the stop to the Sunday night lows at $39/bbl. Finally, a logical place to take profits on our long position would be the highs established prior to the release of the bearish news - this would be $43.69/bbl.
