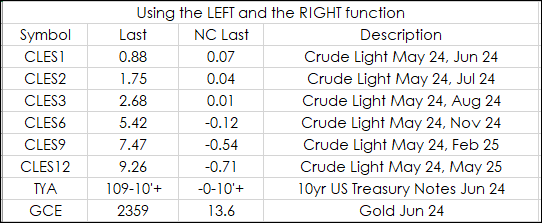
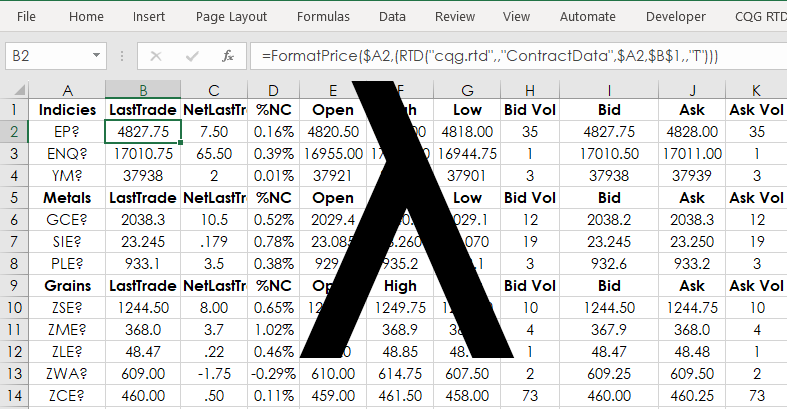
This post offers solutions to parsing data in Excel using string functions. As an example, this RTD formula returns the long description of a Crude Oil calendar spread:
=RTD("cqg.rtd", ,"… moreExcel/RTD
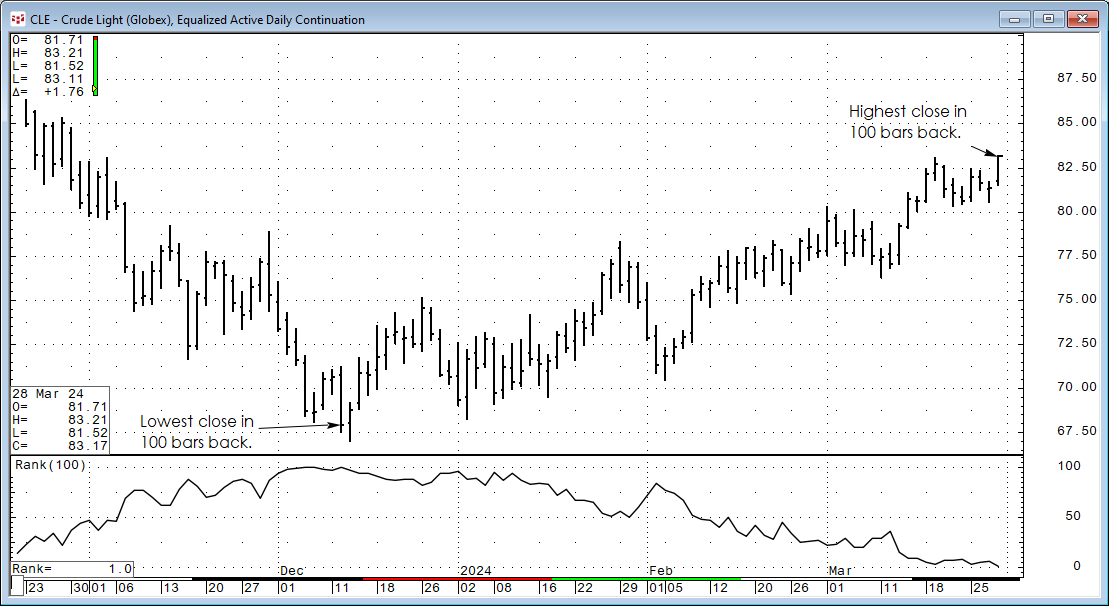
The CQG Rank Study ranks the individual chart points of a market over a specified number of previous trading periods. For example, if the current bar's close had a rank of 3, and the periods were… more
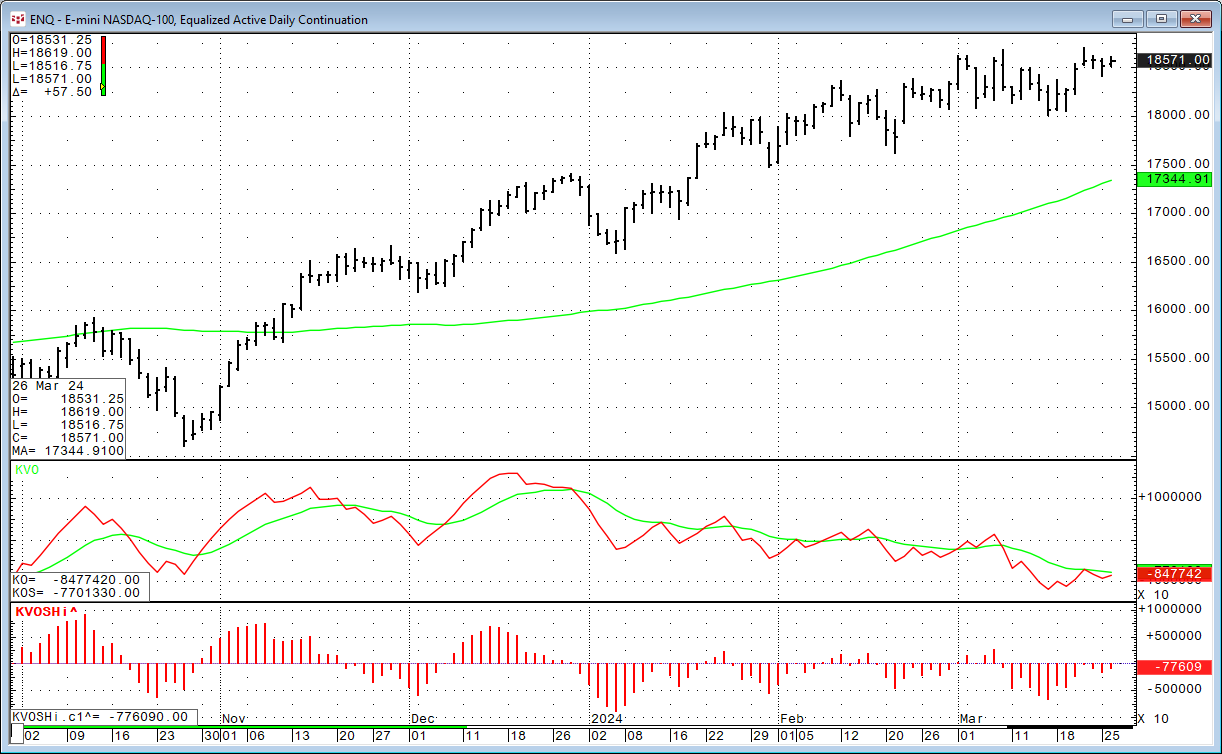
The Klinger Volume Oscillator (KVO) was developed by Stephen Klinger. The study uses the difference between two exponential smoothed moving averages (EMA) of the "Volume Force" and includes a… more
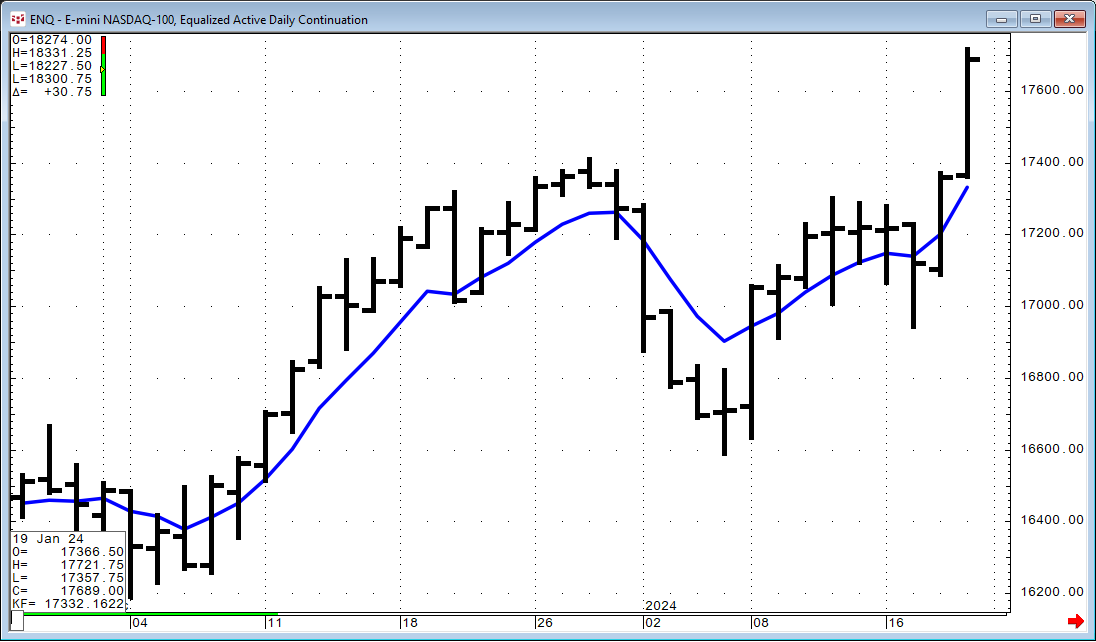
The Kalman Filter is a recursive algorithm invented in the 1960s to track a moving target from noisy measurements of its position and predict its future position. The Kalman filter is an optimal… more
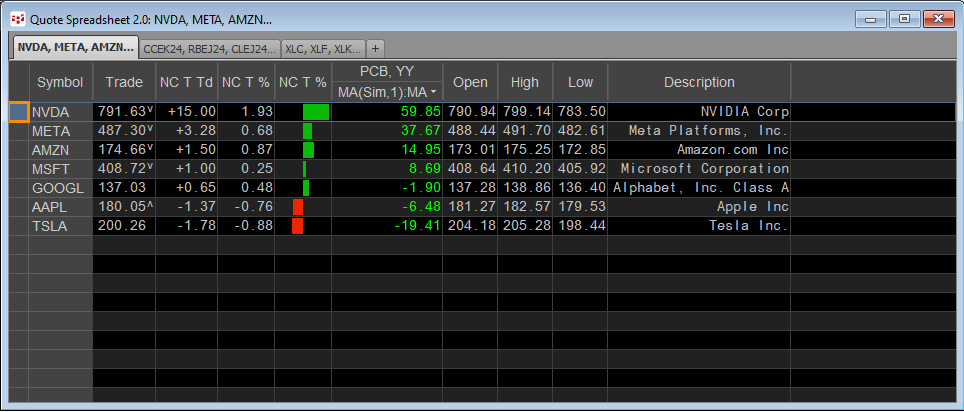
A popular form of market analysis is to maintain a real-time table of market performance based on an annualized basis. For example, the QSS 2.0 displayed below has a sorted column highlighted with… more
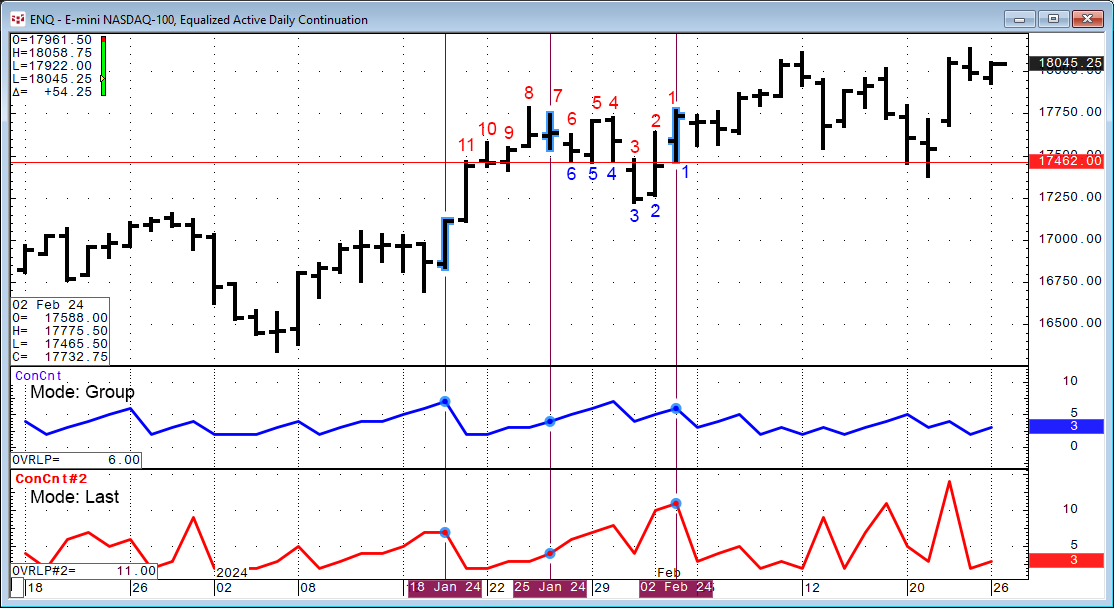
Markets tend to trend up, down, and sideways. Another name for trending sideways is congestion. A period of congestion is when the Open, High, Low, and Close price bars are overlapping. CQG IC and… more
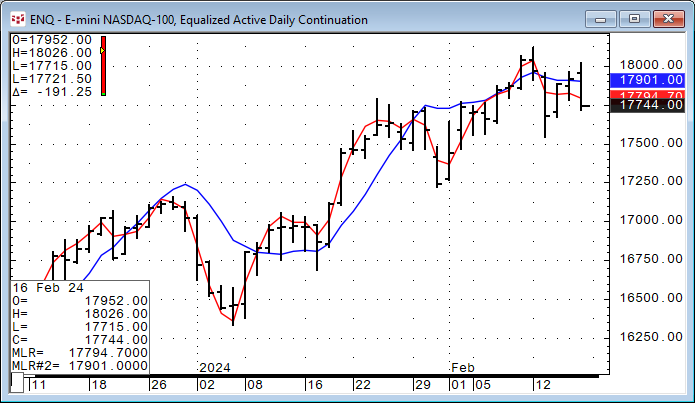
This study goes by a number of other names, including the end point moving average, least squares moving average, moving linear regression, and time series forecast.
To explain this study… more
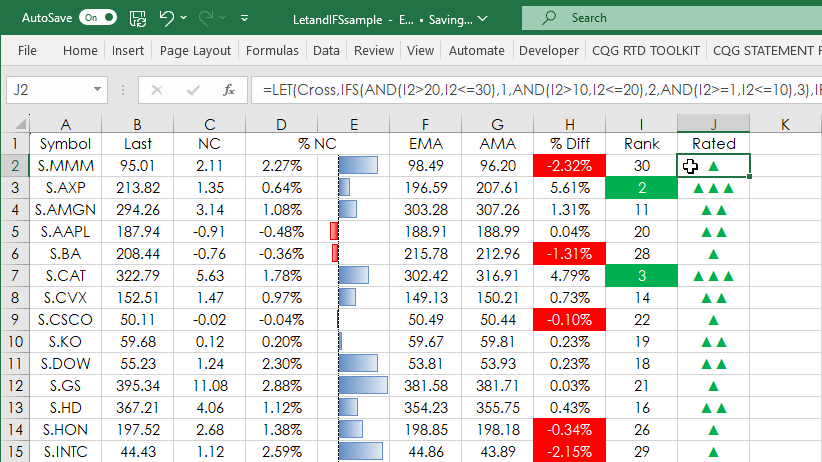
Microsoft Excel 365 introduced the LET Function. Excel 365 or Excel 2016 introduced the IFS function. This post details using the two functions for tracking the performance of the stocks… more
The LAMBDA function is used to create reusable custom functions, which can be called using a "friendly" name. As an introduction to using the LAMBDA function, a previous post detailed using the… more
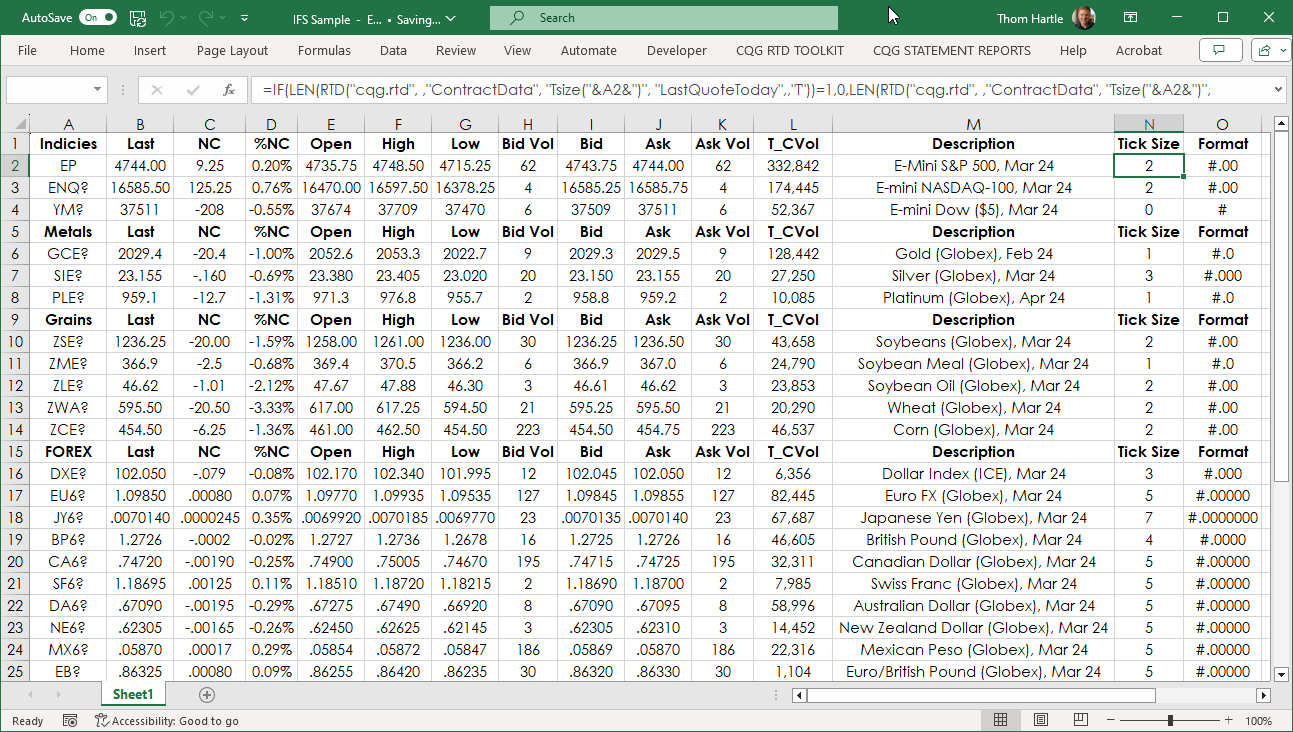
Microsoft Excel 2016 introduced the IFS function. This function can replace using nested IF functions. Below is an example of nested IF functions:
=IF(N2=0,"#",IF(N2=1,"#.0",IF(N2=2,"#.00",IF(… more