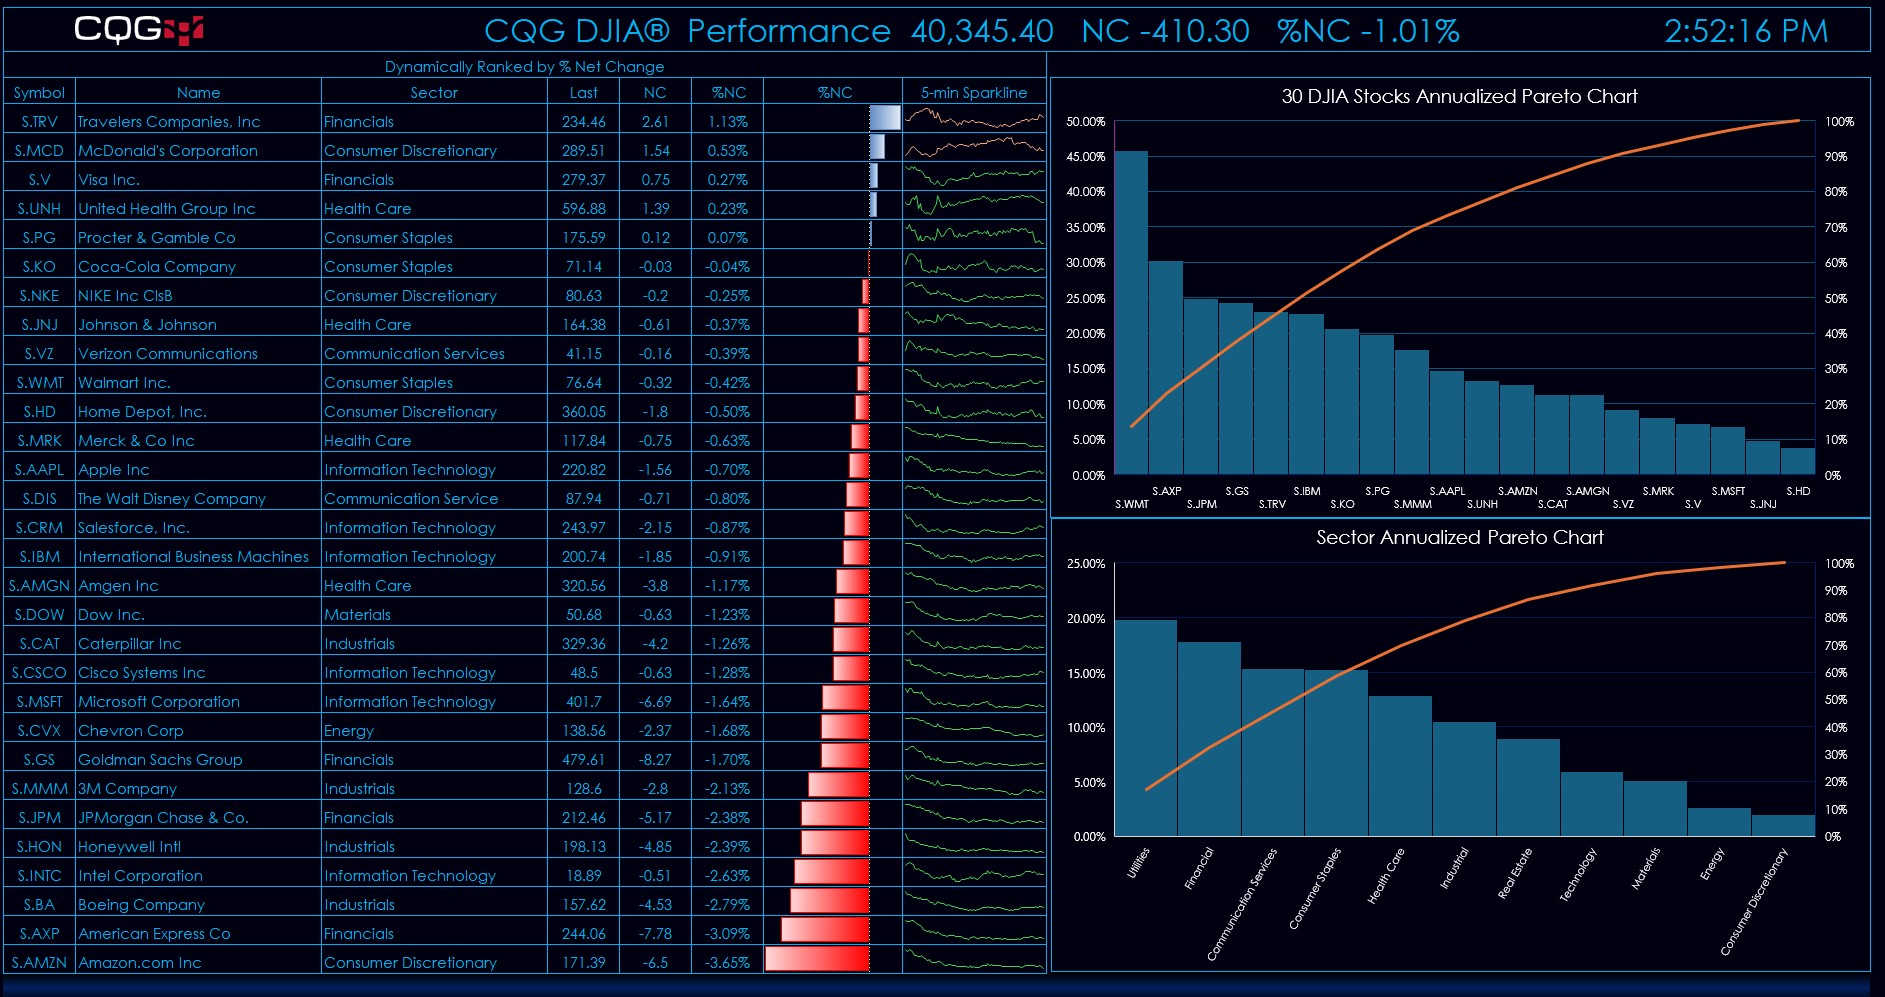
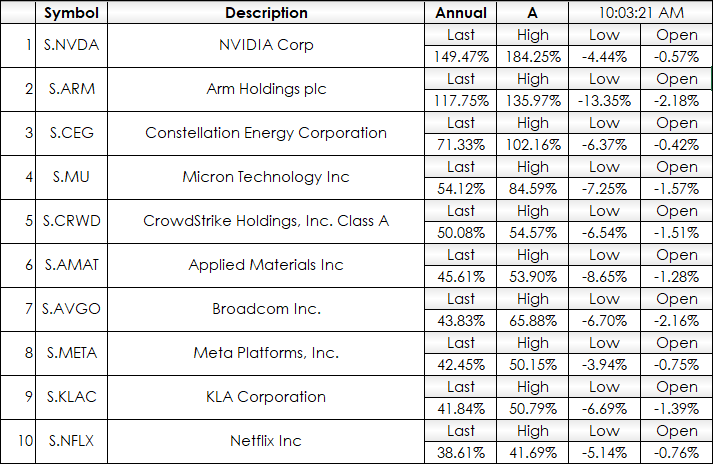
This Excel 365 Dashboard tracks the daily individual performance of the stocks making up the DJIA.
The main display details the symbol, name of the company, the sector the company is listed… more
This Excel 365 Dashboard tracks the daily individual performance of the stocks making up the DJIA.
The main display details the symbol, name of the company, the sector the company is listed… more
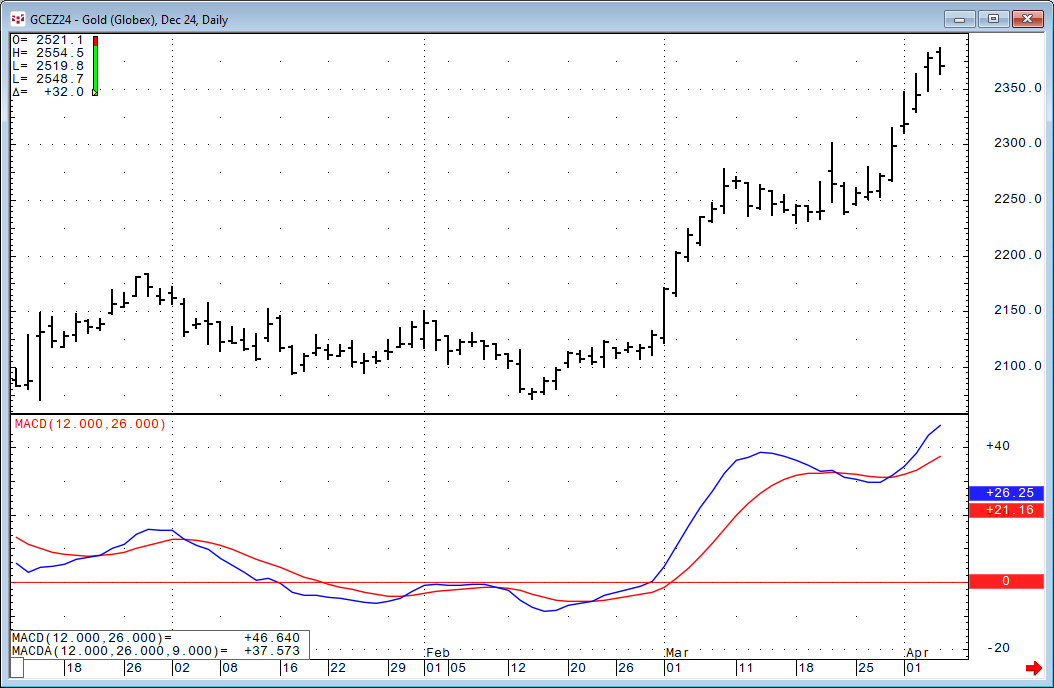
The Moving Average Convergence/Divergence indicator (MACD) was invented by Gerald Appel over 40 years ago. The study is an unbounded oscillator with two lines: MACD and MACDA.
MACD =… more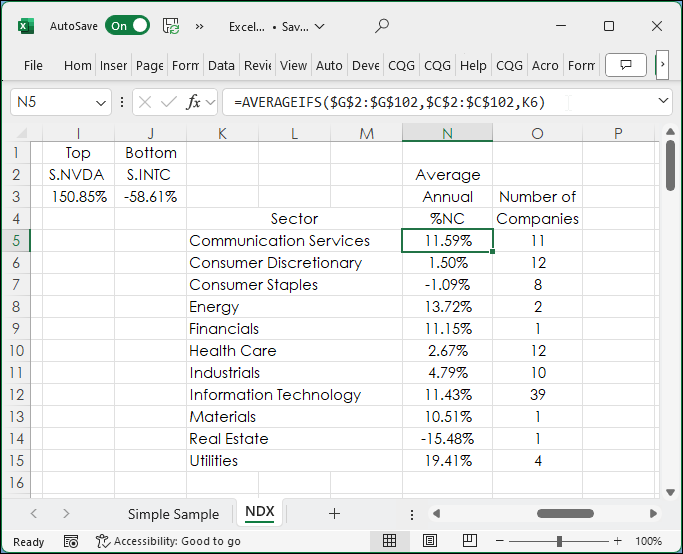
This posts details the use of two Excel functions: AVERAGEIFS and COUNTIFS. To start, a simple example of using the AVERAGEIFS function is presented.
In the image below column cells A2:A10… more
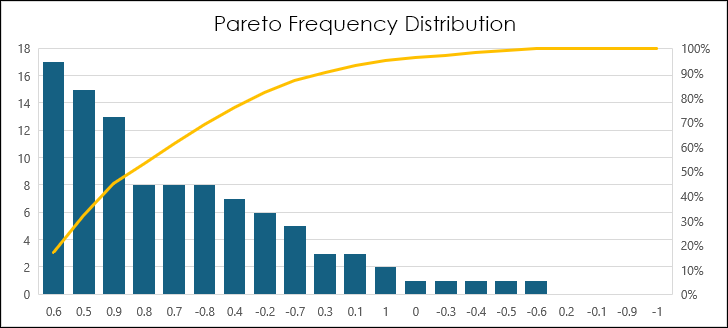
A Pareto chart is a histogram chart displaying columns sorted in a descending order and a line representing the cumulative total percentage. Pareto charts highlight the largest factors in a data… more
The post "Excel Combining SORTBY, CHOOSECOLS, and TAKE Functions" discusses Excel 365's Dynamic Arrays and the concept of returned data automatically "spilling" into a collection of cells.
… more
The Excel 365 Filter function is a member of the Dynamic Arrays group. The function is useful for sorting through a large table of data.
The function is:
=FILTER(Array, Include, [If Empty… more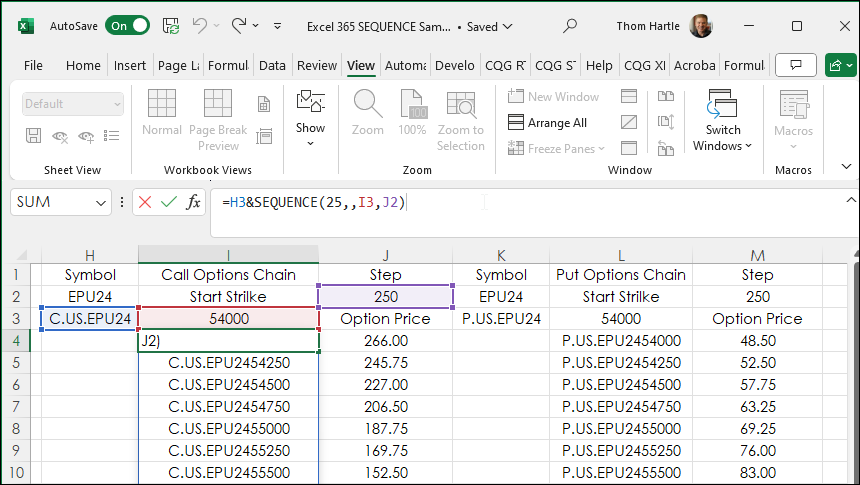
Excel 365 SQUENCE function populates a column or row with sequential integers, such as 1,2,3,4, etc.
The function has four parameters:
SEQUENCE(rows, [columns], [start], [step])
… more
This post, which includes a downloadable Excel sample at the bottom of the post, describes how to use Excel's XMATCH function to search a large table. The table used consists of the constituents… more
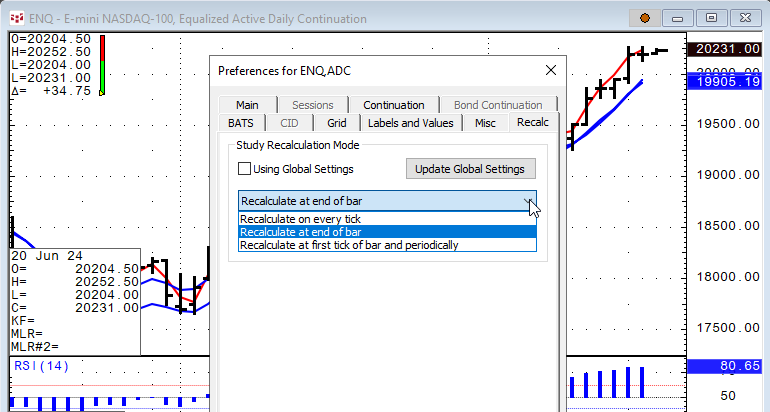
CQG IC and QTrader offer the ability to set recalculation rates for studies. In addition, RTD study formulas have a recalculation rate parameter.
In CQG select a chart and then Setup/Chart… more
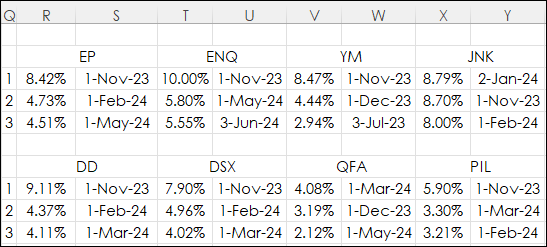
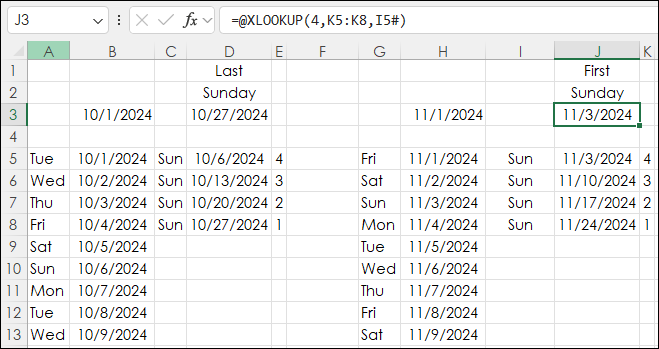
Excel 365 offers the LARGE and XLOOKUP functions. This post details using both for tracking market performance.
The image below is a table from Excel where the data presented are percent net… more