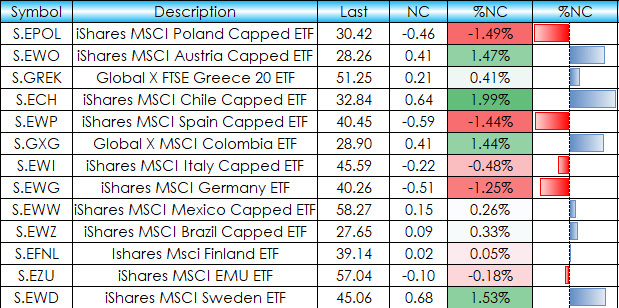
This post details an Excel dashboard tracking Country Equity ETFs performance. The dashboard ranks and sorts the Country ETFs traded using the NYSE American enablement. Fifty-one ETFs are tracked… more
Thom Hartle
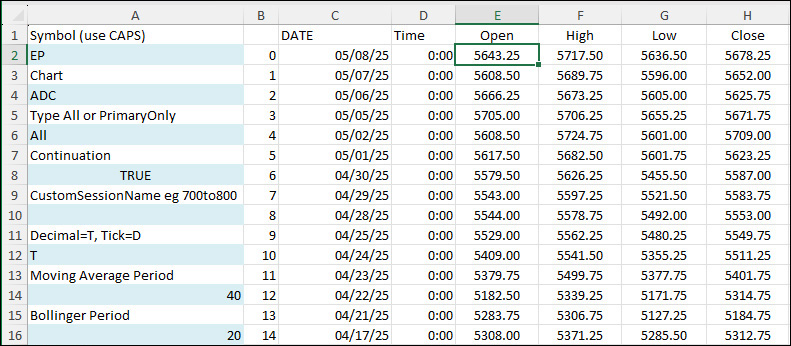
This post offers a downloadable sample Excel spreadsheet for pulling in historical data and study values from CQG IC or QTrader using RTD formulas.
The Data consists of:
Open, High, Low,… more
This midweek look shows the Nikkei 225 (Osaka), Jun 25 contract with a +0.41% gain. The best performer in the US market is the E-mini Dow, Jun 25 contract showing a loss of -0.53%. The best… more
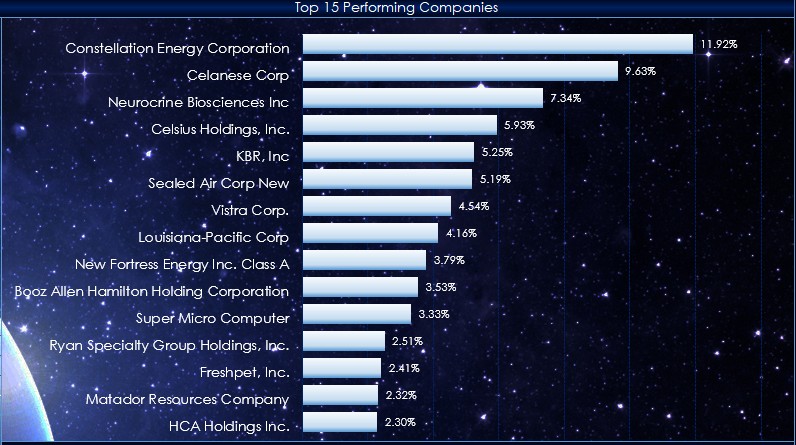
This macro-enabled Microsoft Excel® spreadsheet tracks the holdings of the iShares Russell 1000 Growth ETF (symbol: IWF). The iShares Russell 1000 Growth ETF seeks to track the investment results… more
This midweek look shows the Nikkei 225 (Osaka), Jun 25 contract with a +1.17% gain. The best performer in the US market is the NAE-mini Dow, Jun 25 contract showing a gain of +1.40%. The… more
This midweek look shows the Nikkei 225 (Osaka), Jun 25 contract with a +1.46% gain. The best performer in the US market is the NASDAQ-100, Jun 25 contract showing a gain of +2.28%. The best… more
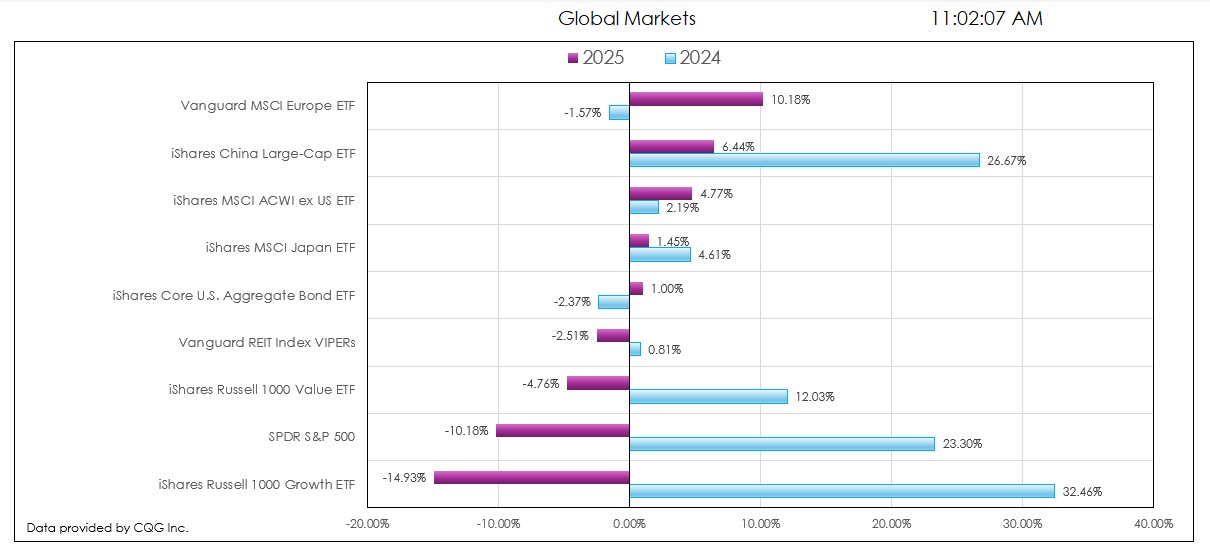
This post details the downloadable Excel Market Performance Dashboard's features and functions. The dashboard has seven tabs (the first is data and the other tabs display a chart and a table of… more
This midweek look shows the Nikkei 225 (Osaka), Jun 25 contract with a +0.95% gain. The best performer in the US market is the E-mini MidCap 400, Jun 25 contract showing a gain of +0.05%.… more
This midweek look shows the Nikkei 225 (Osaka), Jun 25 contract with a +3.20% gain. The best performer in the US market is the E-mini NASDAQ 100, Jun 25 contract showing a gain of +9.84%.… more
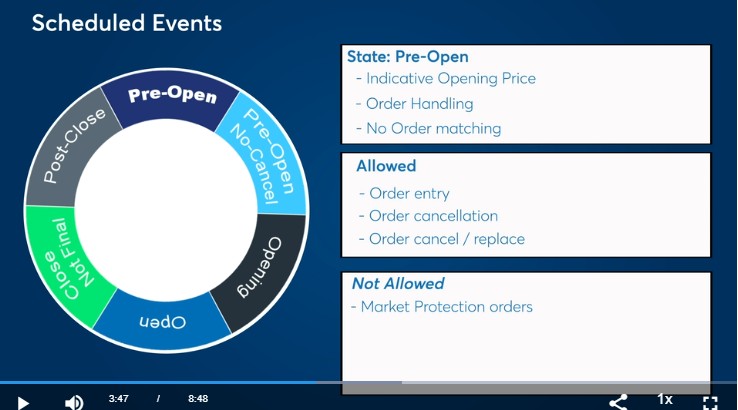
Various Exchanges offer market data detailing the current state of a market. This includes the CME Group, the Intercontinental Exchange (ICE), CBOE Futures Exchange (CFE), and others.
For… more