The Excel DGET function extracts a single value from a column of a list or database that matches conditions that you specify.
The syntax is DGET(database, field, criteria).
The DGET… more
The Excel DGET function extracts a single value from a column of a list or database that matches conditions that you specify.
The syntax is DGET(database, field, criteria).
The DGET… more
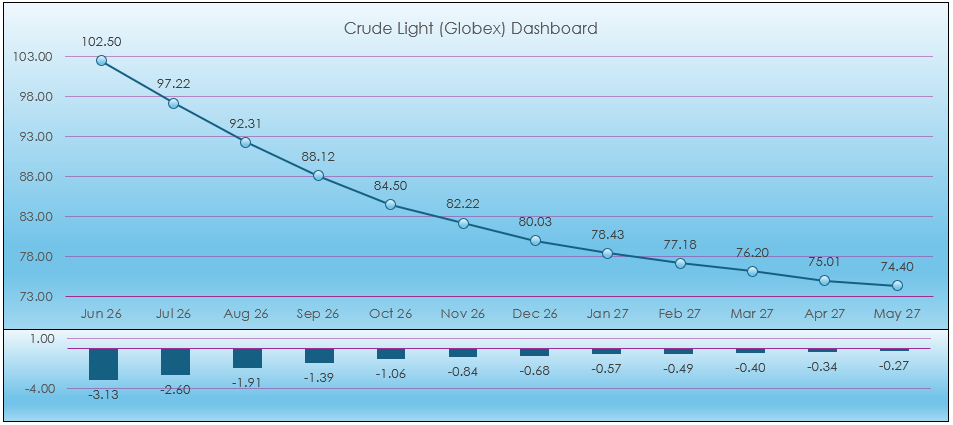
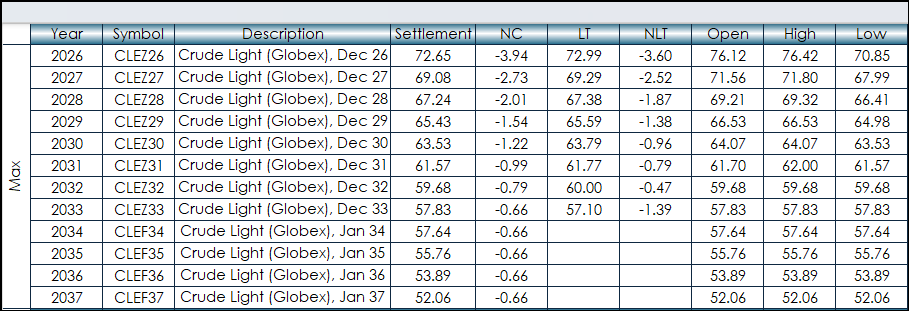
This post presents a macro enabled Excel Light Crude Oil dashboard using combined functionality detailed in previous Workspace posts. The dashboard uses numerous RTD calls for today's market… more
This post builds upon the post: Excel Agriculture Dashboard Using the FILTER Function.
The original post built market quote display blocks using a data tab with specific row ranges employed… more
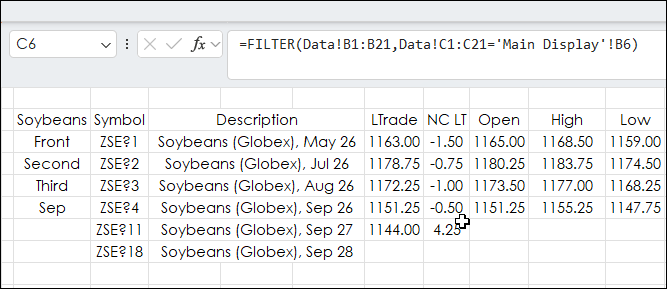
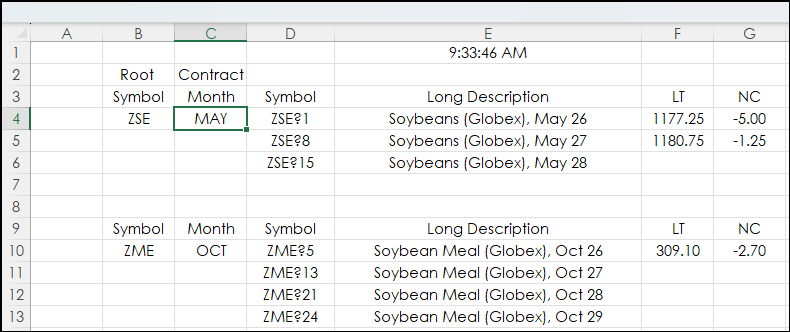
This Excel dashboard tracks agriculture markets and uses Excel's FILTER Function to pull the same month's contract data from each year.
The markets tracked are Soybeans, Soybean Meal,… more
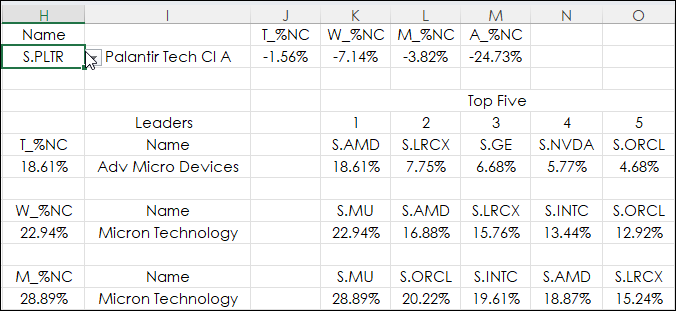
This post is similar to the recent post "Excel 365 GROUPBY and XLOOKUP".
That post introduced using the Excel function GROUPBY to arrange by sectors the stocks in the NASDAQ 100 and identify… more
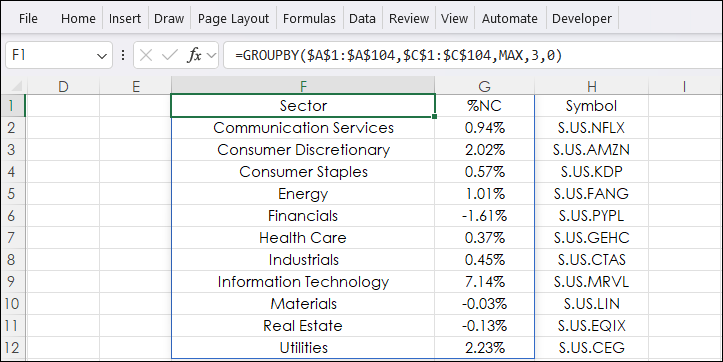
Excel's GROUPBY function offers the ability to create a summary of data. The data can be grouped, aggregated, sorted, and filtered based on the fields you specify.
The syntax of the GROUPBY… more
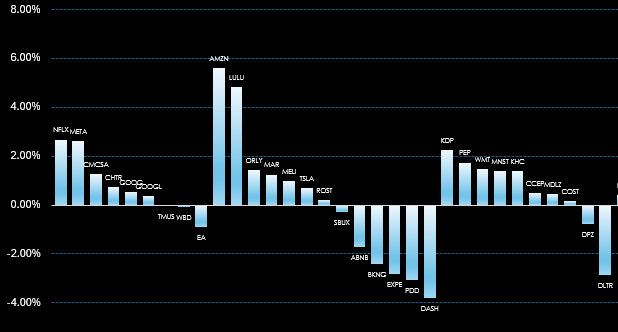
The Excel dashboard at the bottom of the post displays the stocks tracked in the NASDAQ 100 Index broken down by the 11 Global Industry Classification Standard (GICS) sectors.
The NASDAQ 100… more
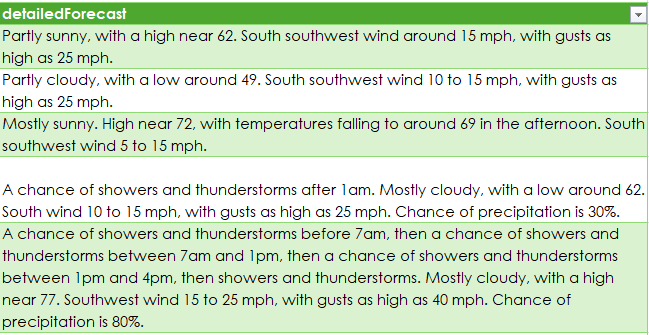
This post details the Excel sample at the bottom of the post using Excel's Power Queries to pull in weather forecasts for a city. There are four steps:
Determine the latitude and longitude of… more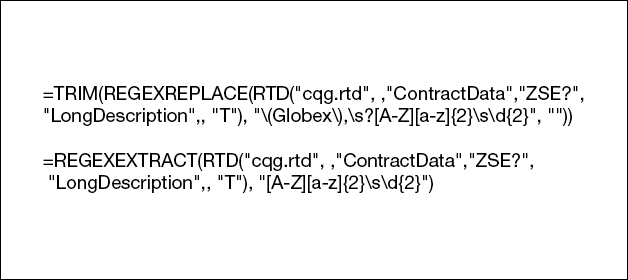
Excel's REGEXEXTRACT function enables enhanced text extraction based on patterns using regular expressions (regex) rather than fixed positions. This function enables you to pull specific data from… more

Microsoft Excel's PROPER Function simply "Capitalizes the first letter in a text string and any other letters in text that follow any character other than a letter. Converts all other letters to… more