
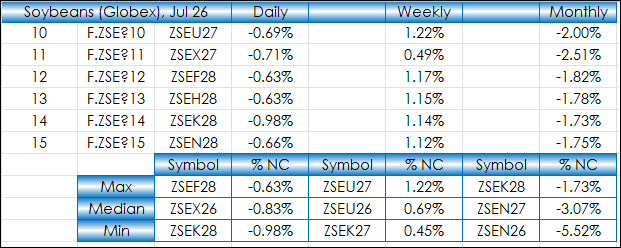
This post walks through using Excel's XLOOKUP with Min, Median, and Max Functions to create a summary table of market performance for the forward curves of Soybeans, Soybean Meal, Soybean Oil,… more
Workspaces
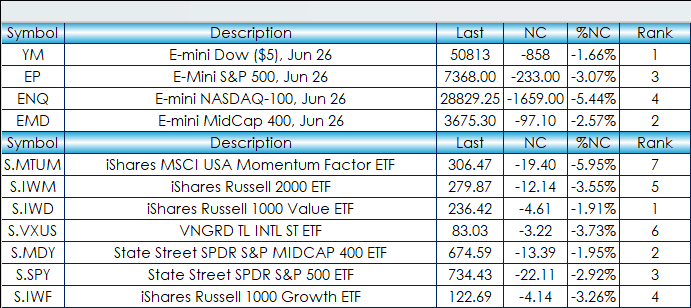
This post offers a sample spreadsheet with typical RTD formulas used for building a market quotes dashboard. You can download the dashboard and enter in symbols. All capital letters are required.… more
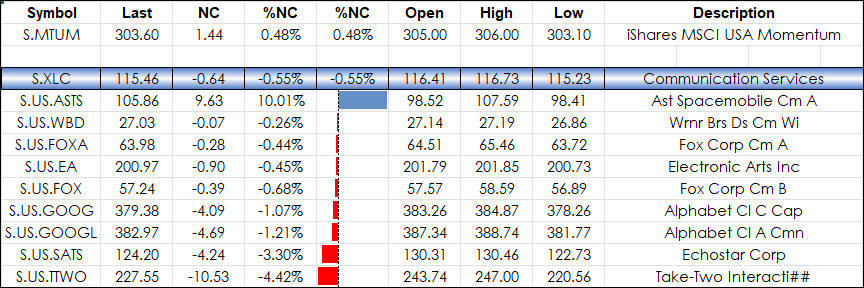
From the iShares website:
The iShares MSCI USA Momentum Factor ETF (Symbol: MTUM) seeks to track an index of U.S. stocks exhibiting relatively high price momentum. The fund offers a way to… more
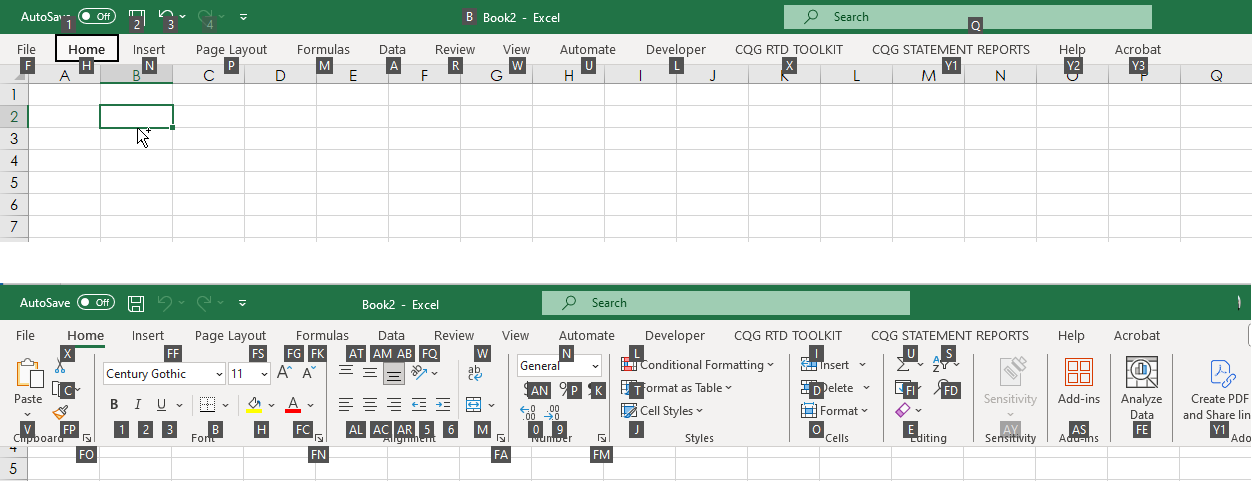
Knowing Excel Shortcuts will increase your efficiency with designing your Excel dashboards. There is a previous post, "Excel Keyboard Shortcuts," that detailed Excel shortcuts that eliminated… more
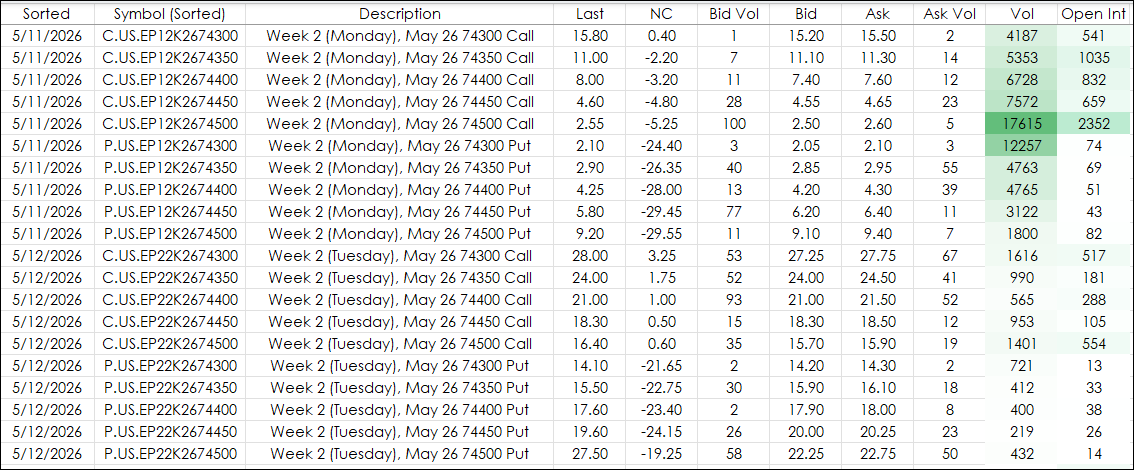
This options dashboard uses a combination of functionality from the CQG RTD Toolkit and Excel functions including SORT, FILTER, and RIGHT to track the options market. The markets monitored are the… more
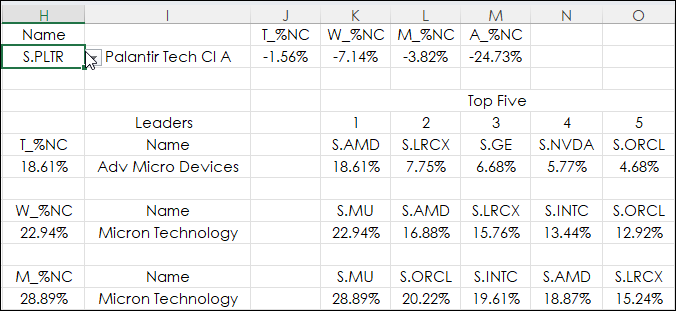
The Excel DGET function extracts a single value from a column of a list or database that matches conditions that you specify.
The syntax is DGET(database, field, criteria).
The DGET… more
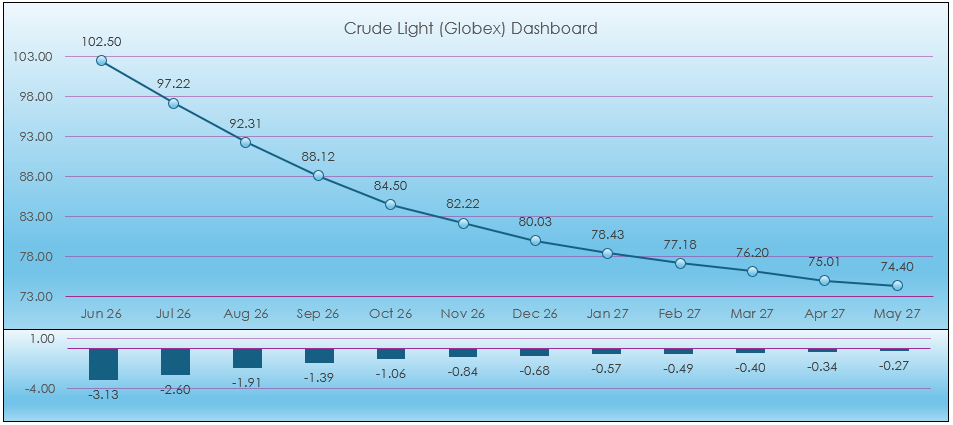
This post presents a macro enabled Excel Light Crude Oil dashboard using combined functionality detailed in previous Workspace posts. The dashboard uses numerous RTD calls for today's market… more
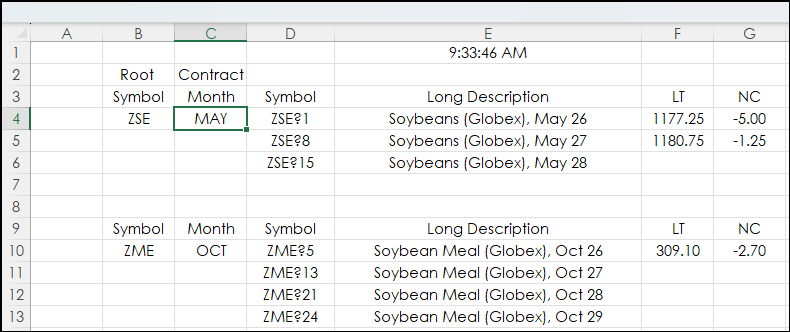
This post builds upon the post: Excel Agriculture Dashboard Using the FILTER Function.
The original post built market quote display blocks using a data tab with specific row ranges employed… more
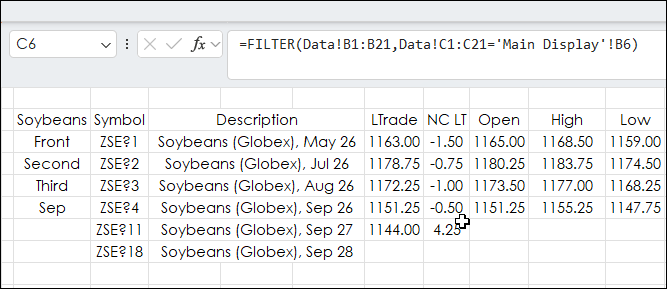
This Excel dashboard tracks agriculture markets and uses Excel's FILTER Function to pull the same month's contract data from each year.
The markets tracked are Soybeans, Soybean Meal,… more
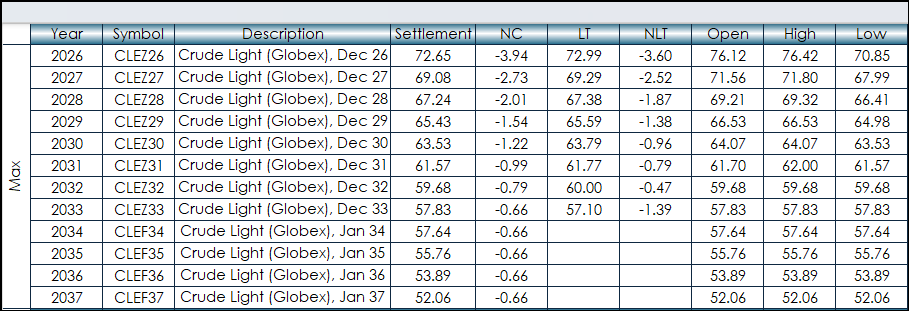
This post is similar to the recent post "Excel 365 GROUPBY and XLOOKUP".
That post introduced using the Excel function GROUPBY to arrange by sectors the stocks in the NASDAQ 100 and identify… more