This macro-enabled Microsoft Excel® spreadsheet tracks the holdings of the iShares Core S&P U.S. Value ETF (symbol: IUSV). The iShares Core S&P U.S. Value ETF seeks to track the investment… more
Workspaces

This macro-enabled Microsoft Excel® spreadsheet tracks the holdings of the iShares Core S&P U.S. Growth ETF (symbol: IUSG). The iShares Core S&P U.S. Growth ETF seeks to track the… more
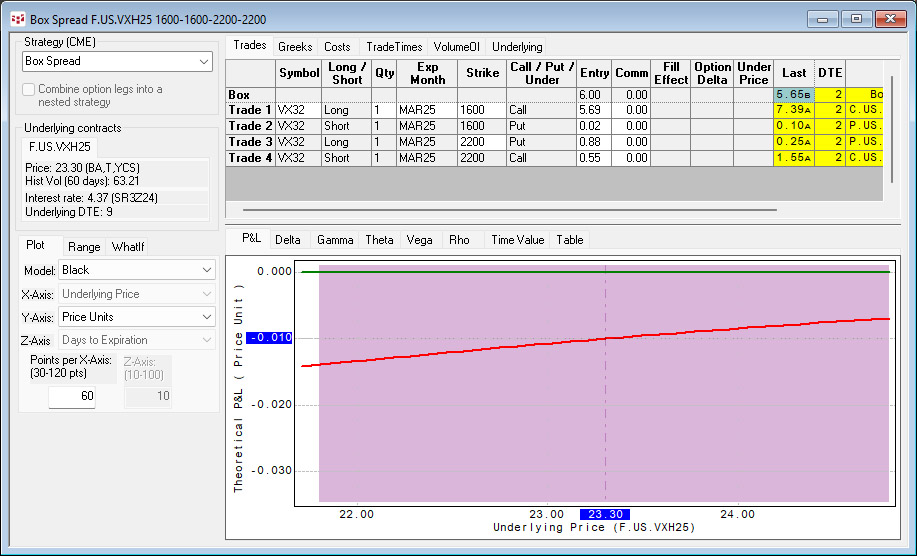
October 14, 2024, the Cboe launched weekly options on the Cboe VIX futures. To find the symbols in IC or QTrader, open the Symbol Search, select Cboe Futures Exchange (CFE), sort the Asset column… more
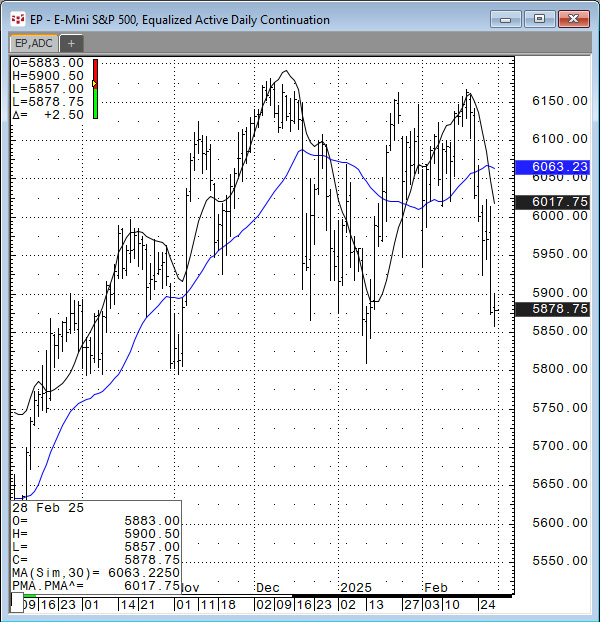
In the March 2025 issue of Technical Analysis of STOCKS & COMMODITIES magazine John Ehlers, President of MESA Software, presented "A New Solution, Removing Moving Average Lag."
The… more
CQG Integrated Client and CQG QTrader support RealTimeData for sending data and other market information to Microsoft Excel®. This feature opens up many opportunities for creating custom displays… more
When writing formulas for calling market prices into Microsoft Excel® using RTD, you can choose between four different formats for the values returned. Here, I will review those formats and offer… more
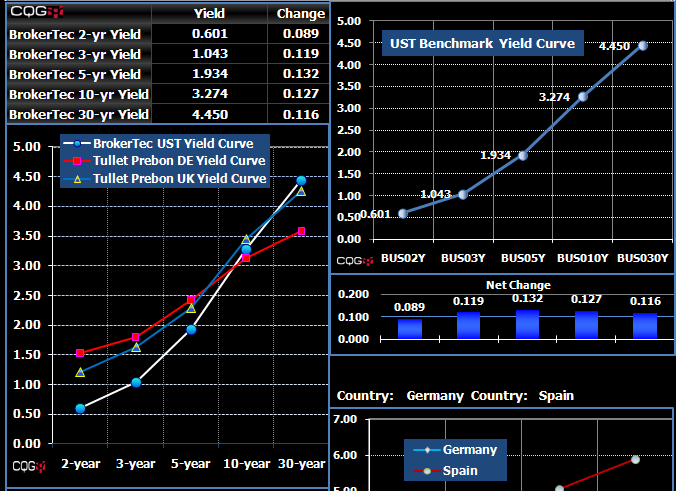
This macro-enabled Microsoft Excel® spreadsheet tracks the holdings of the SPDR® S&P® Bank ETF (symbol: KBE).
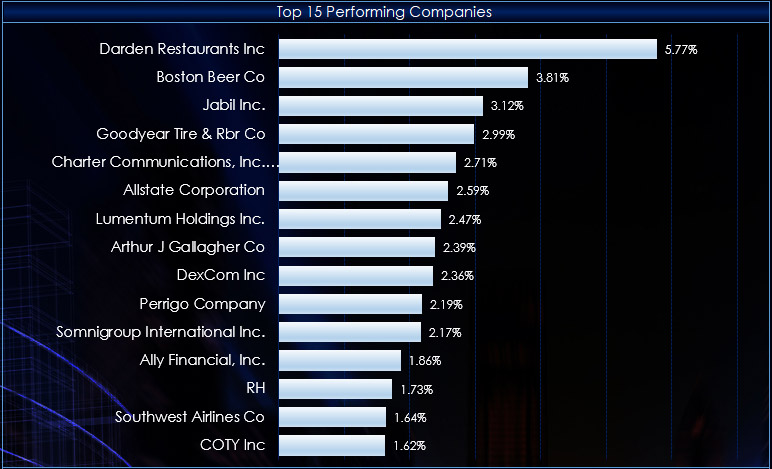
Throughout the trading session, the individual stocks are dynamically ranked… more
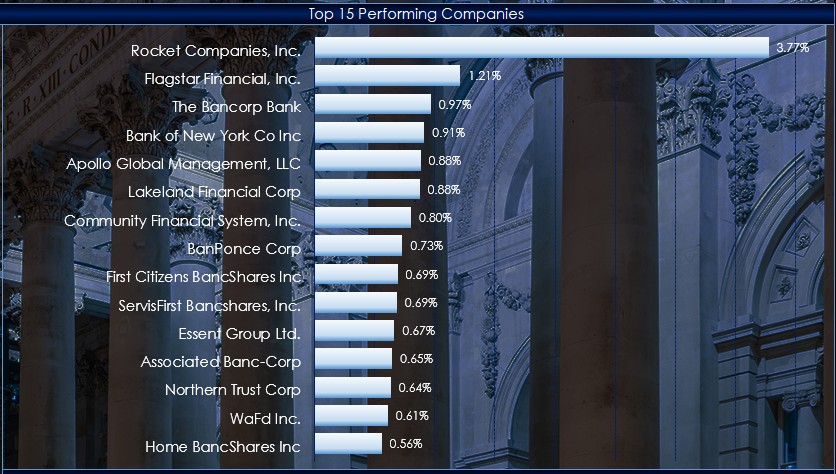
This macro-enabled Microsoft Excel® spreadsheet tracks the holdings of the Financial Select Sector SPDR® ETF (symbol: XLF).
Throughout the trading session, the individual stocks are… more
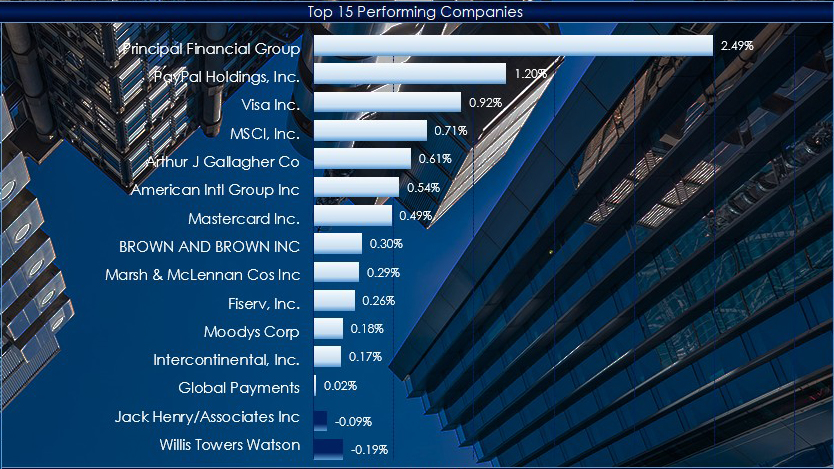
This macro-enabled Microsoft Excel® spreadsheet tracks the holdings of the SPDR® S&P® Biotech ETF (symbol: XBI).
Throughout the trading session, the individual stocks are dynamically… more

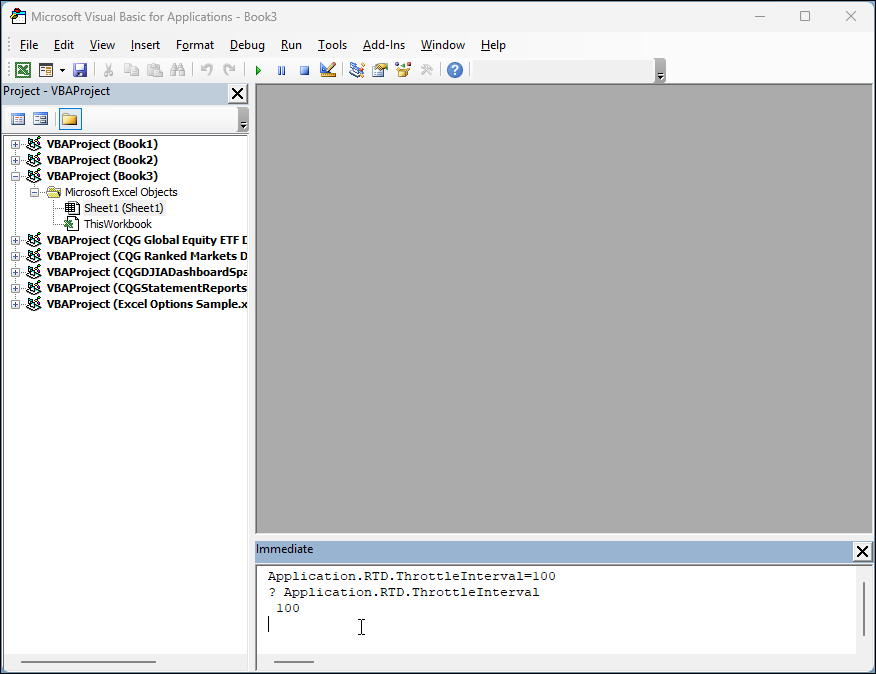
The PriceToDollar function converts the prices of the particular market to their value. For example, below the E-mini S&P 500 futures contract's last price is 6003.75. And 6003.75 multiplied… more