Volatility Time Bands looks at each specific time of day to previous days (22 days) and then places 1,2 and 3 standard deviations on the opening price around that average of range. This maintains flexibility to market changes and crucially provides fixed concepts of what risk and expectation can be in any next point in time.
The use of the opening creates a study with predictive powers since the bands' calculation references the current opening, they automatically create bands around this level. For the day trader using short-term charts, this means there is an immediate reference. This Bands can also be placed on the DOM Ladder from multiple timeframes, thereby providing points where there is a confluence of levels.
For the day trader there is a range of extreme and expectation as well. This is an improvement on the traditional pivots that remain so popular today. Pivots suffer from various flaws. If the previous day's range is narrow, the next day's pivots will contract. They take no consideration of the domination that news flow creates as the time bands do. Conversely, when there is a large range day, the following day's pivots expand. The average of the last few days' ranges can be taken to try and smooth out this problem, but it still lacks the dynamic nature of the Volatility Time Bands.
Another problem with pivots is opening gaps. As the values are based on the previous bar they take no consideration of gaps, meaning that they can be irrelevant from the opening. By using the opening, the Volatility Time Bands are still relevant, however big the gap. This is particularly useful for stocks where overnight news sees a dramatic shift in value.
The first consideration is: over how many bars or days should the volatility be calculated? Logic suggests that the minimum period to calculate is 22 days. This should always cover an entire month's statistics. They will also retain a more dynamic relationship to any changes in range and volatility.
The day trader can utilize 30 or 60-minute bars and if a trend is developing and the trending timeframe increasing the Stochastic Steps Study from last month's update tells you what that Trending Timeframe currently is.
There are various questions that can be answered by studying the bands:
- What is the trend?
- How strong is the trend?
- Is the trend accelerating?
- Has the trend changed?
- Has the trend reached an extreme?
- Is that extreme likely to mark the end of the trend? What is the Volume for the Time of Day
There are many ways to ascertain whether price is in a trend, whether it is a moving average, MACD or a trend line. But these indicators simply tell us what the trend has been and often are a considerable distance away from the current price or would require a large shift in direction to make the indicator of choice suggest that the trend is ending. Another problem, as noted earlier, is that many traders base their momentum studies on the close, meaning that there is no predictive basis of risk on the current bar. With Volatility Time Bands the trend can be defined and risk quantified.
Method 1
If the market is trending higher, then prices must at least reach the 1st standard deviation above, and not close lower than the 1st deviation below. The level acts as a support in an uptrend and a stop out point on a close below. This is for the most risk-averse trader.
Method 2
If the market is trending higher, then prices must reach at least the 1st deviation above and never touch the 1st deviation below. This highlights a very strong trend.
Method 3
If the market has been trending up and then prices do not reach the 1st deviation up, and close below the 2nd deviation down, the trend has ended.
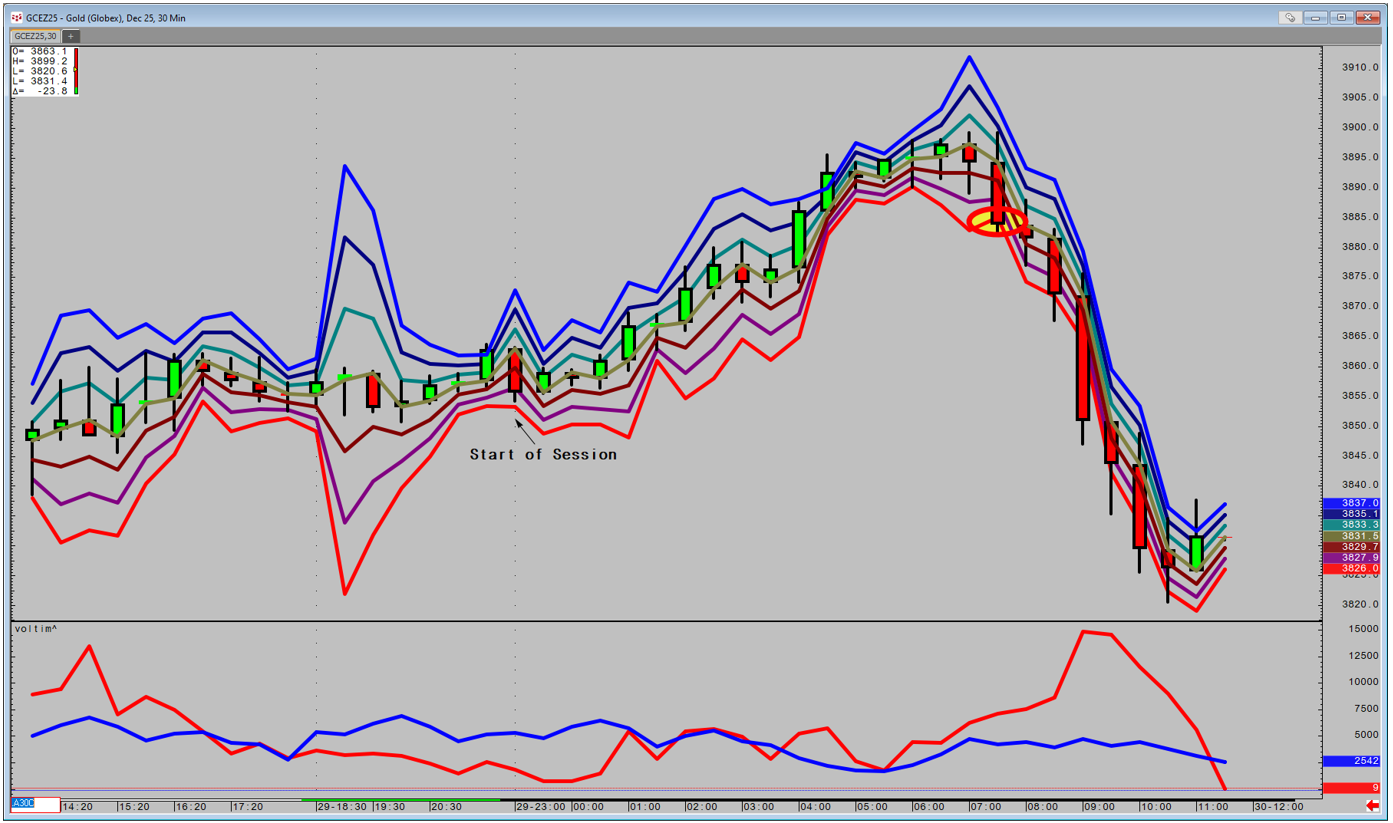
Today's initial uptrend is Gold is a good example. Price is consistently reaching at least 1 up before hitting 1 down as circled, but it does not close below. Price then accelerates and even moves above the 3rd Deviation before hitting the 3rd Deviation down as circled. This is the first sign of weakness. Finally, price fails to reach the 1 Deviation up at the top, before a sharp reversal on the next Candle shows that the trend is over by closing below the 3rd Deviation down.
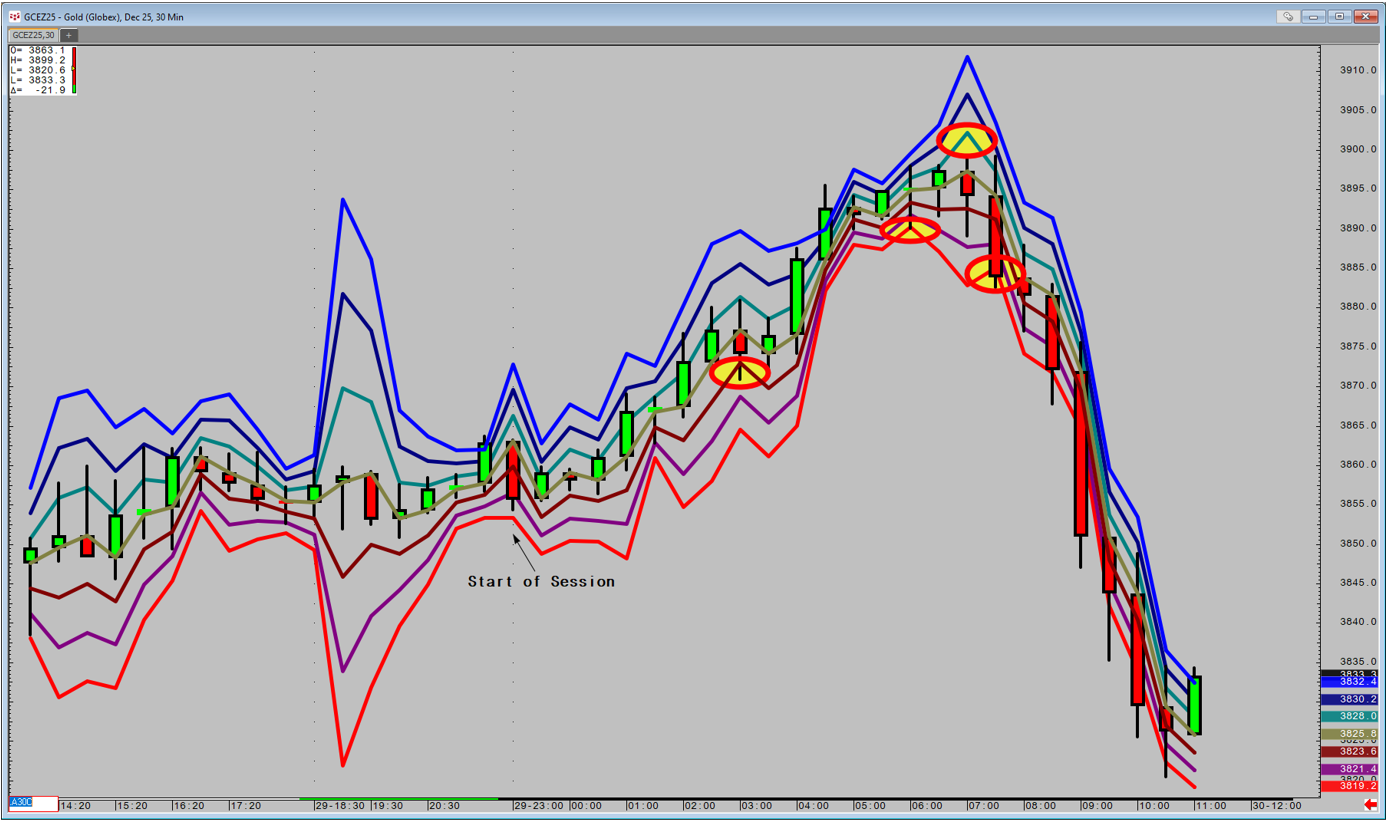
Volume for the Time of Day is also very useful in quantify the Bands. At the first circle price closed below the 3rd Deviation down indicating a new downtrend. Looking at volume it was also nearly double what it normally is for that time of day indicating selling pressure. Price then hits or closes below the 3rd Deviation down 5 times in a row in volume that at times is 3 times above the average volume. Note that the highs on each Candle often reach the first or second deviation up before resuming the slide. Finally, the downtrend ends as we fail to reach even the first deviation down and trade above the third Deviation up. The downtrend is over.