One of the theories behind Market Profile®* is the opening trading range. This is the high and the low from the first hour of trading. We want to create a trading system around that and use the Super Template to save a lot of time.
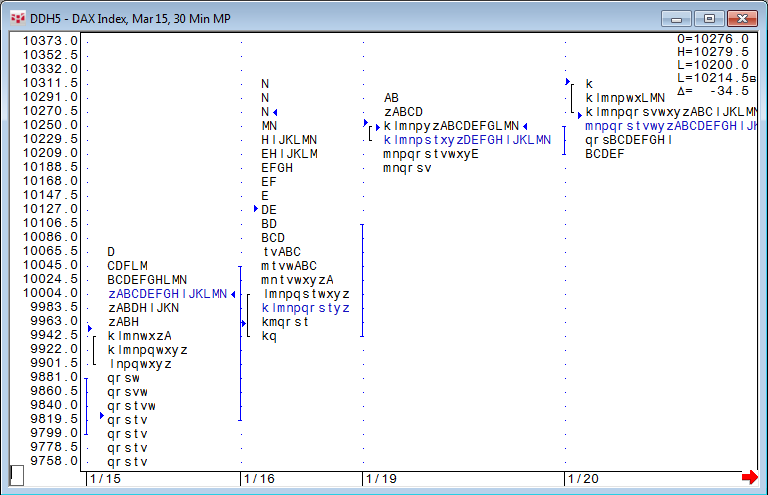
January 16 (German FDAX) is a textbook example of a double distribution trend day. We have a very small opening range, and the market breaks out to the up side and builds a new distribution almost 300 points higher.
In order to use the breakout scenario, we actually do not need Market Profile to get this done in our backtesting and auto execution environment. We can use normal bar or candlestick charts.
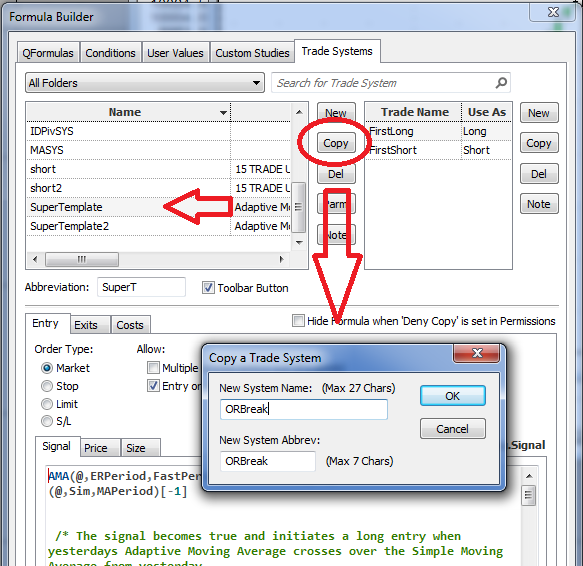
As a first step, copy the super template into a new trading system: in this example, ORBreak for Opening Range Breakout.
If you do not have the Super Template trading system on your system already, please check the initial article for the download.
There is a small change from CQG 2014 to 2015. CQG 2015 includes an additional function called DollarToPrice, which is editable. It does not replace Dollar2Price, which is not editable. Both functions will work. This function is available on the Add Study window and in the Formula Toolbox. Price to Native Currency converts price units to US dollars.
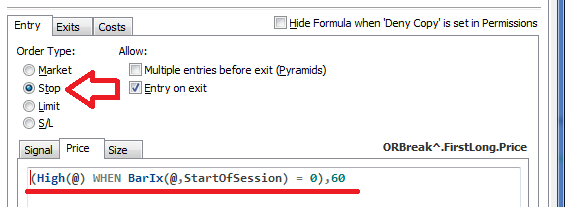
The breakout logic needs to go into the price field. We reference the 60-minute high of the first bar each session for the long trade and use the same logic with the low for the short trade.
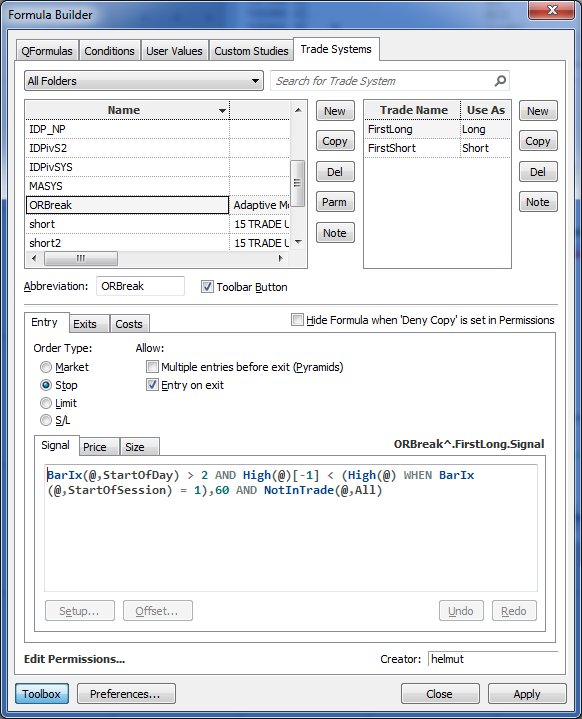
We also need to delete the old code from the signal tap and add two logic helpers to it.
- I don't want to trade before the first hour is over. Assuming I am on a 30-minute bar for testing, I could add the following code to the signal field:
BarIx(@,StartOfDay) > 1 - I don't want to trade again after an exit, so I want the high one bar before to be underneath the trigger line. (We used this trick in the last backtesting sample.)
- I don't want to trade long when I am still in a short trade or vice versa.
Now we can start having a look into the trading system using all the built in exits from the Super Template Trading system, except the so called Real exit because this one still refers to the AMA sample. So delete the Real exit on both sides.

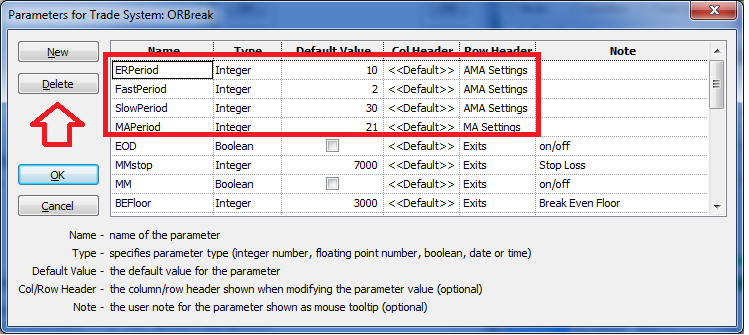
While cleaning it up, I would also delete the Parameters ERPeriod, FastPeriod, SlowPeriod, and MAPeriod as they are no longer used.
For the first test, I am using these exits:
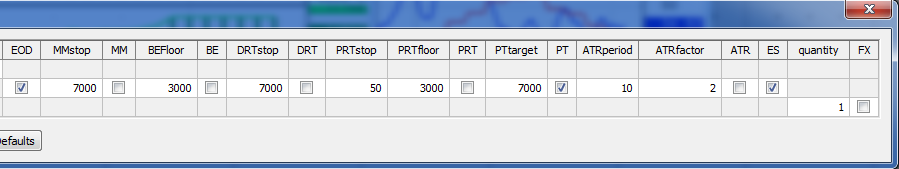
- EOD = End of Day
- PTtarget = Profit Target @ 7000€
- ES = Entry Stop (it is the low of the entry bar for long trades and the high for short trades)
- Quantity is one contract
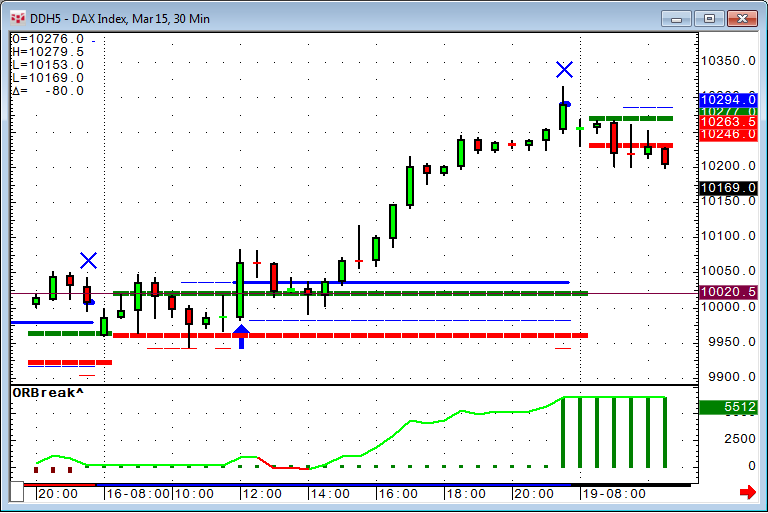
Here is our January 16 textbook example again:
I am using a separate study to visualize the two entry levels.
On January 16 we had a narrow initial trading range with a false short breakout that caused a 1100€ loss. The second breakout to the long side accelerated and we closed the position at the end of the day with 6700€ profit.
It did not take the first breakout on the third bar of the day because we defined the rule that the previous high must be below the trigger line to accept the breakout. Because the second bar high is actually creating the level for the trigger line, this trade did not happen.
One technique to avoid false breakouts is to trade a few ticks beyond the initial trigger line in order to not fire your trade if the market is only testing these levels.
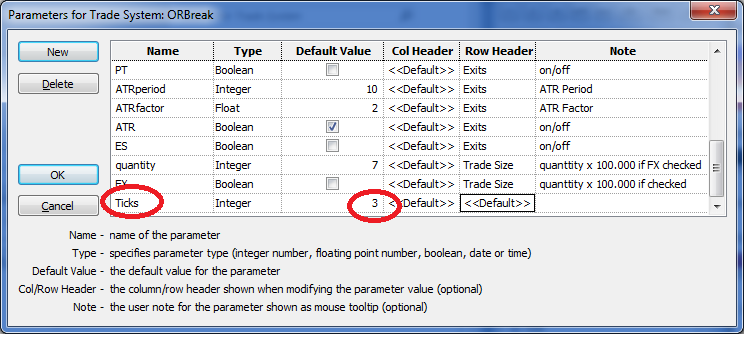
This can be done very easily by adding a few ticks to your stop order. First we create the parameter Ticks that will define the distance to the opening range line.
In the price field for Long I need to put the initial calculation into brackets and add the code "+ Ticks * TSize(@)" for long trades and "- Ticks * TSize(@)" for short trades. TSize is automatically the smallest increment a market can move. In the case of the DAX, it is 0.5 points (12.5€).
In order to rule out the first false short breakout, we need to add 34 ticks (17 Points = 425€) to the opening range line. This is quite an unusual high value and kills a lot of profitable trades.
Now it is time to play with all the other exits and see how they influence the total P&L and other statistics.