A couple of months ago we looked into CQG's built-in Divergence Index and how to use it.
Following up on this topic, I want to show a much simpler approach using the Formula Toolbox.
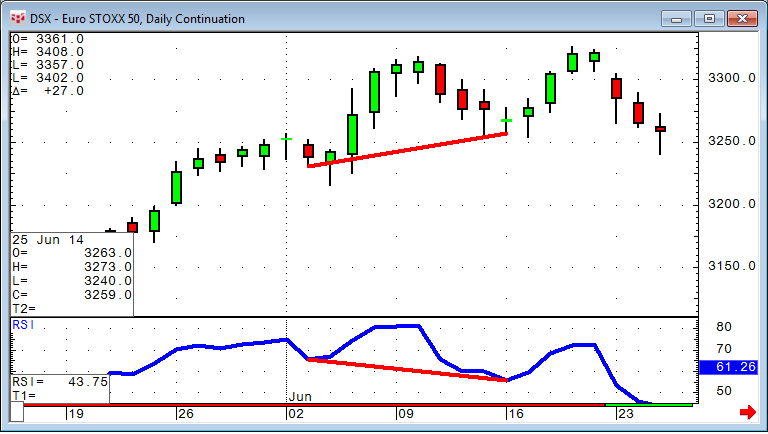
A divergence is when an indicator (here the RSI) is making a lower peak, but the market actually is trading higher, or vice versa. This can be spotted manually using simple trend lines, but the situations are very easily overlooked. Here is a step-by-step approach for finding these using conditions for a marking bar with almost every indicator.
As step one, I create a simple condition that should help me identifying the indicator's high and low peaks. The low peak is defined as a low value confirmed by at least one higher value on the right-hand side and five higher values on the left-hand side. These are the parameters LEFT and RIGHT.
I keep the indicator as a variable first to make simple copies of the condition and just swap the indicator if needed.
Condition for low:
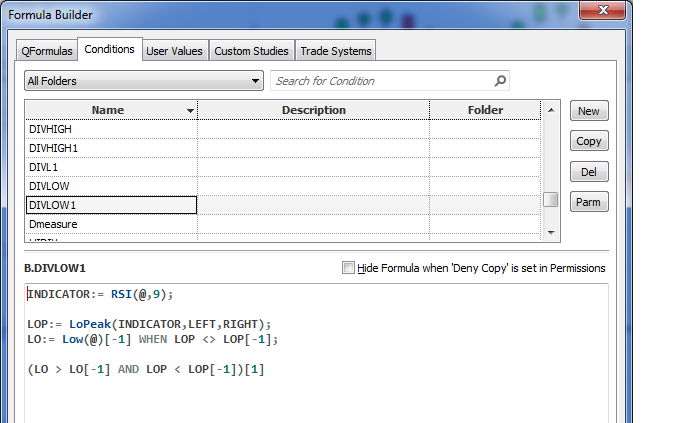
INDICATOR:= RSI(@,9);

(LoCount(INDICATOR,LEFT,RIGHT) = 1)
Condition for high:
INDICATOR:= RSI(@,9);

(HiCount(INDICATOR,LEFT,RIGHT) = 1)

Because of the one-bar confirmation to the right, the signal actually kicks in one bar after the peak. I can either keep it that way or use a simple trick to tweak the formula to be displayed one bar before.

I think it looks much clearer now.
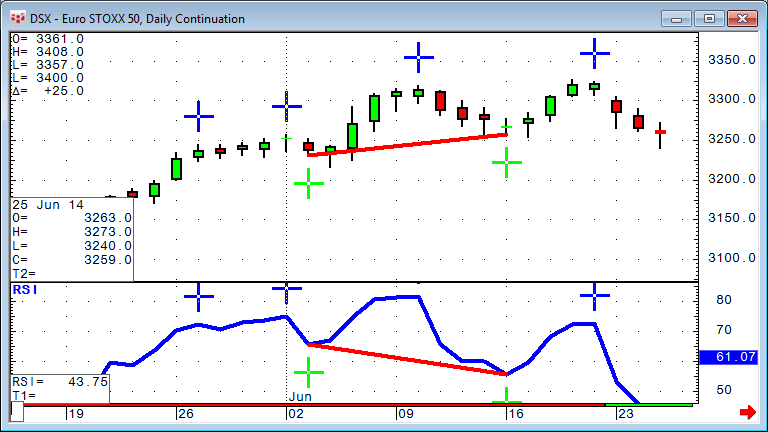
These peaks are only there to help me visualize the points that are used for the actual divergence calculation.
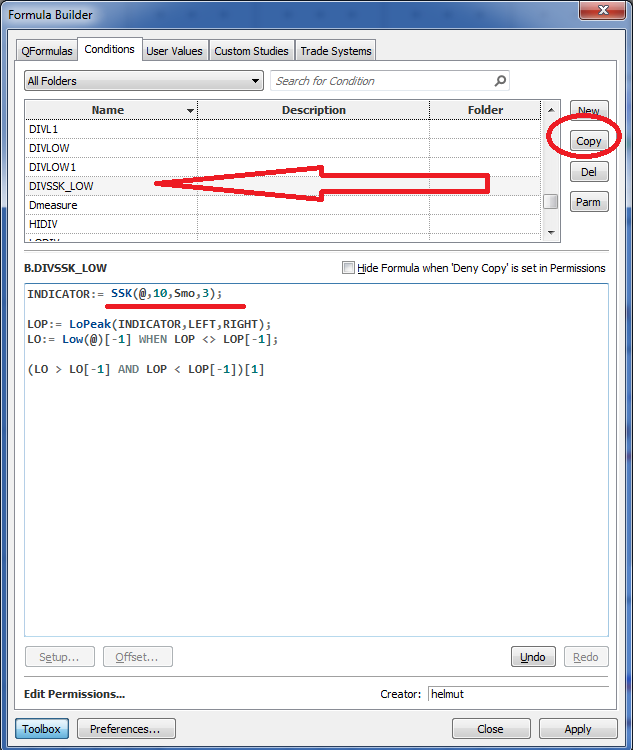
INDICATOR is used again to be flexible with the actual indicator the divergence will be based upon.
LOP is measuring the LoPeak of the actual indicator.
is measuring the low of the bar anytime the value of the LOP changes.
trick again to mark the signal bar.
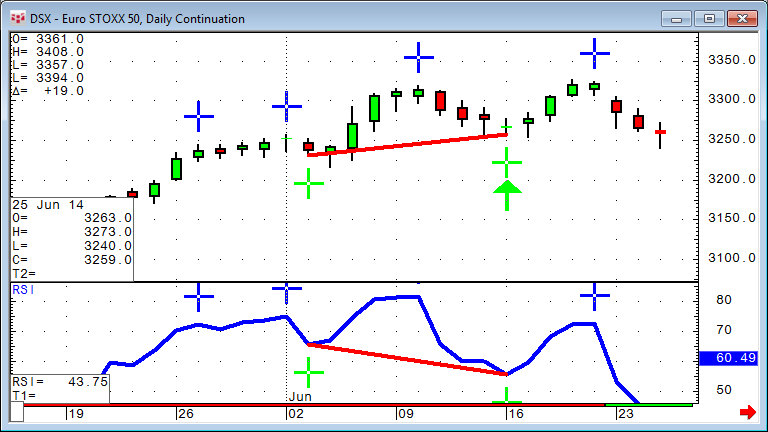
The green arrow is now indicating the divergence on the chart. The crosses are not really needed, but they help see from where to where the divergence will be measured. You can remove them and the divergence condition will still work.
Keep in mind that you can manipulate the parameters of how far you want to look left and right to confirm that the peak is a significant peak. Using 1 and 1 as parameters will result in more signals.
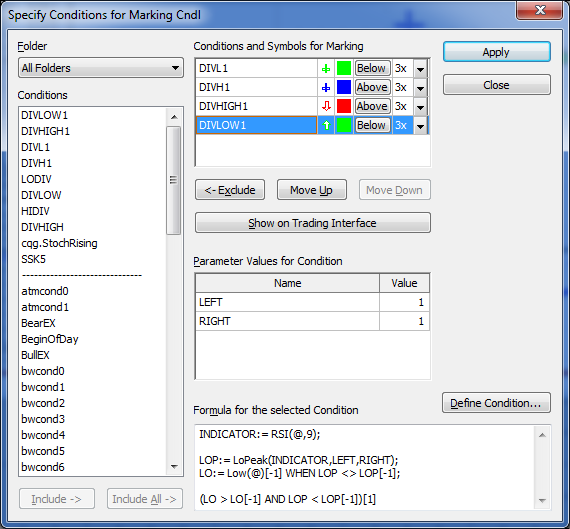
To create a new condition for measuring divergence against another indicator, I just copy the condition to a new one and substitute the RSI with whatever study I want to use.