If you build your own indicators, you may have been stuck feeding your own calculation back into a study parameter. The CQG front-end does not allow this directly, but we have a smart workaround to make it work. Thanks to Jim Stavros for sharing this smart trick.
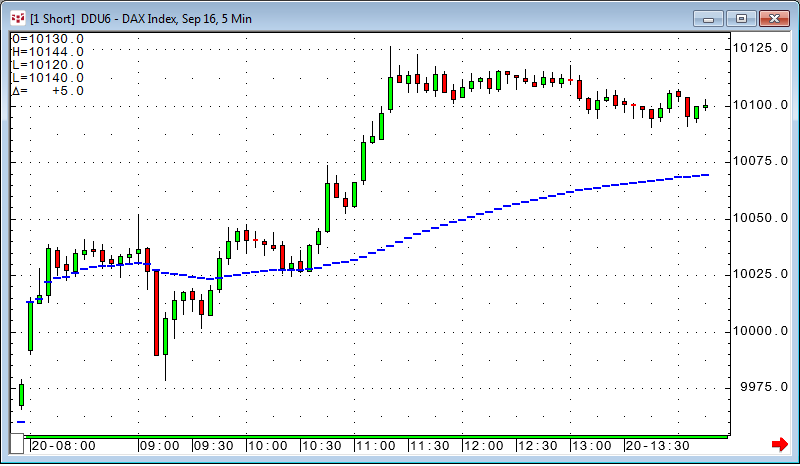
This is a very simple example of the Fluid Indicator (flexible length moving average). The idea is to have a one-bar moving average on the first bar of the day, a two-bar moving average on the second bar of the day, and so on. So we need to feed the number of bars elapsed back into the parameter of the moving average:
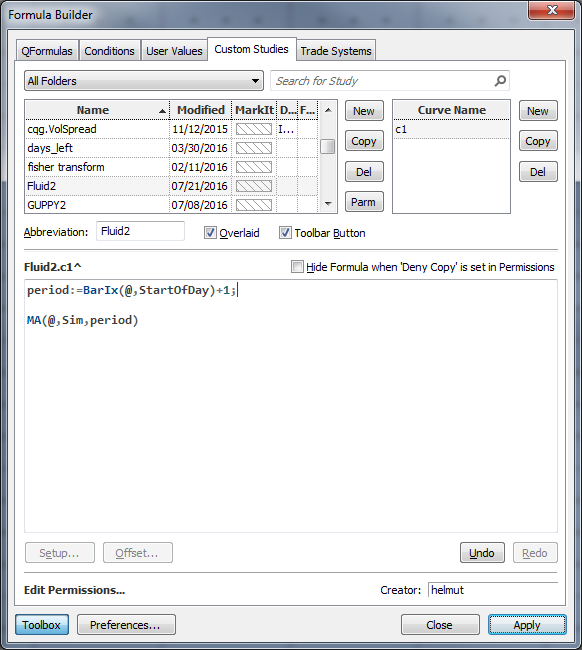
period:=BarIx(@,StartOfDay)+1;

MA(@,Sim,21)]
We create a custom study called Fluid using CQG's formula toolbox.
The first line is a variable called period to calculate the number of bars elapsed using the Bar Index function. Bar Index historically starts counting with zero from the start of the day, so we add “+1” to the code to have the first bar of the day with a value of one instead of zero. The second line is the moving average itself. The problem now is that you cannot substitute the fixed value of 21 with the variable period.
The workaround to accomplish it is as follows:
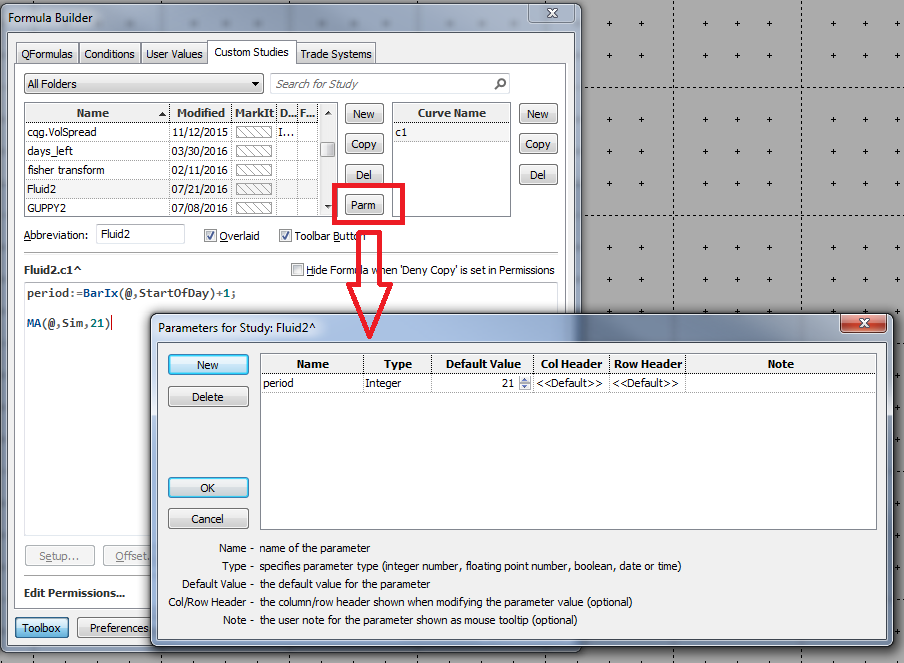
You create a parameter (Parm) called period. It is vital to use the same name as the variable in your code: if you mistype it, it will not work. The value of the parameter does not matter.
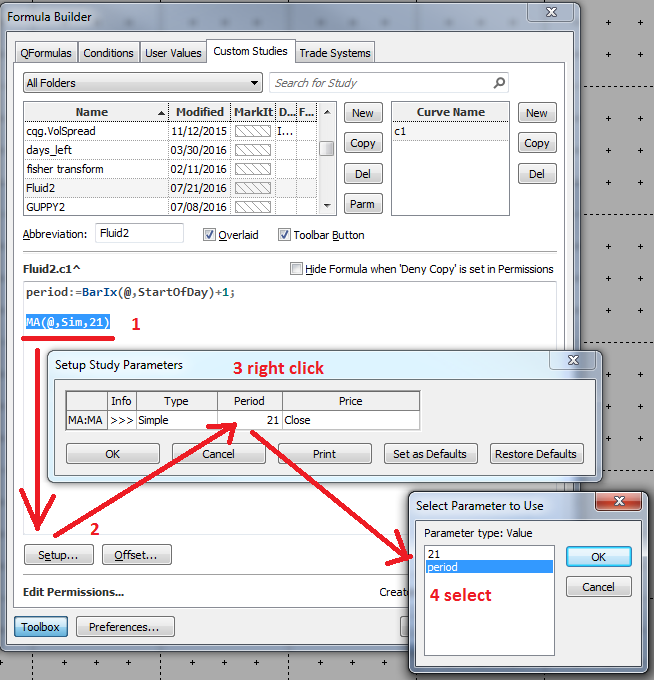
Now highlight the moving average and select Setup. Right-click in the period field, and select the parameter period. Confirm everything and click OK.
The moving average now reads like this: MA(@,Sim,period)
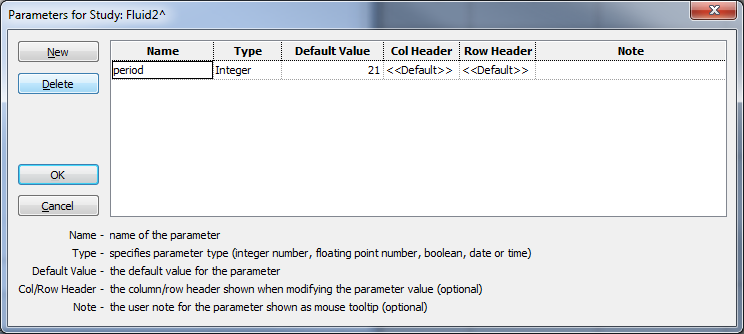
The last step is to go back to the Parm button and delete the parameter period there.
This is it! It is simple, but not quite obvious that you can do it.
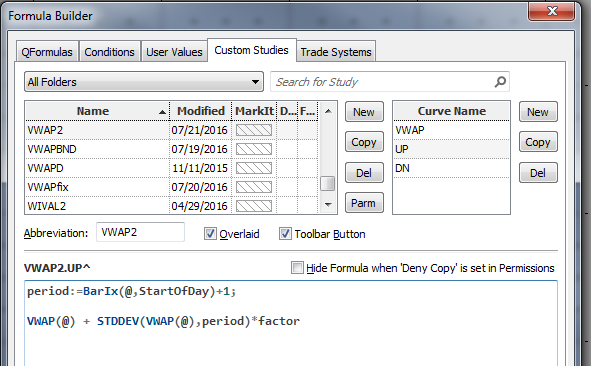
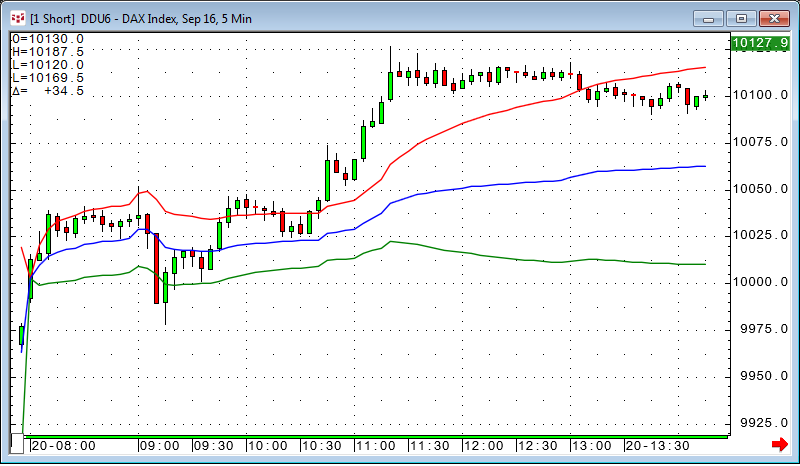
A second example using exactly the same trick is a study adding Standard Deviation Bands with a flexible period to the Volume-Weighted Average Price (VWAP).
VWAP is the volume-weighted average price for a futures contract plotted as a line on the price chart. The calculation is the sum of traded volume times the price divided by the sum of the traded volume.
This study has a number of uses. It provides the current volume weighted average price for the trading day or the trading session. Traders can compare the current price to the VWAP. In addition, the VWAP can be calculated using a set look-back period, and you can smooth the price data similar to a standard moving average.
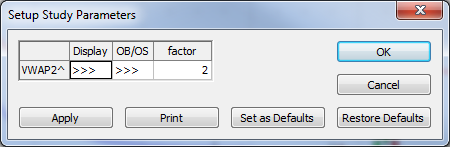
The new study has three curves: Curve number one is the VWAP itself. The other two curves are adding or subtracting n-times the standard deviation to or from the VWAP. The standard deviation has a normal period that will be substituted by the number of bars elapsed the same way we did in the first example. The calculation also has a factor of how many times the standard deviation will be added or subtracted from the VWAP.
Don’t forget to remove the parameter after creating the code. If you keep the parameter, it will result in an error message.
Make sure you right-click the study curves and select Modify [study name].
Click the tree arrows under Display.
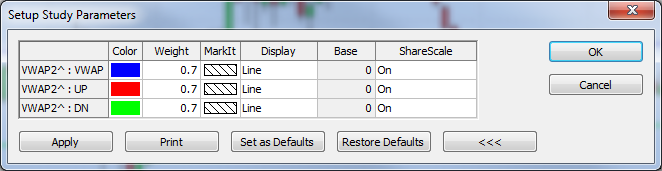
Set your favorite colors, make sure ShareScale is set to On, and then click Set as Defaults.
Both studies are included in the PAC file below.