After renewing the Super template in July 2022 I also created a set of trading systems based on very commonly used indicators. The exits are summarized at the end.
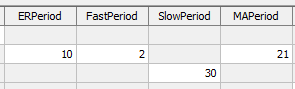
1. AMA trading system S22AMA
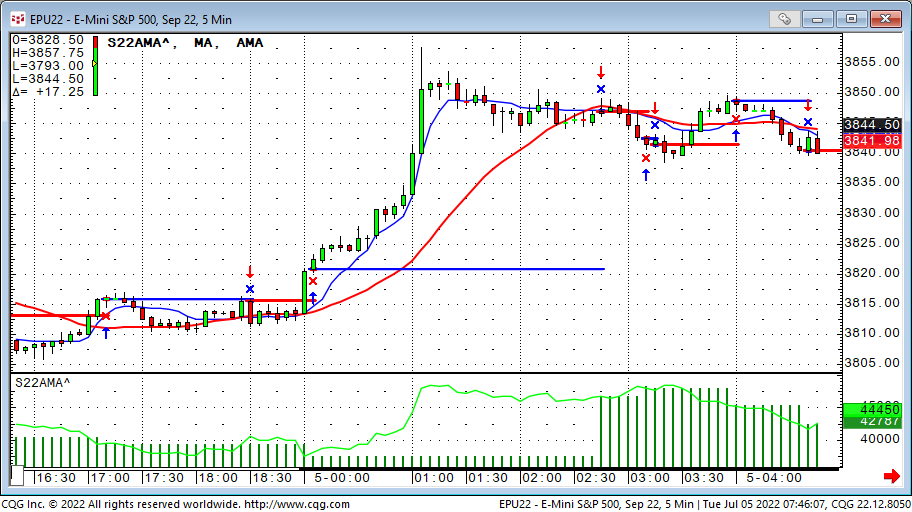
The AMA trading system is technical identical to the 2022 super template itself.
https://news.cqg.com/workspaces/2022/07/super-template-2022
The entry triggers when the AMA crosses above or below the simple moving average.
The Adaptive Moving Average (AMA) study is similar to the exponential moving average (EMA), except the AMA uses a scalable constant instead of a fixed constant for smoothing the data.
The formula for the exponential moving average is:
EMA(today) = C*(price(today) – EMA(yesterday)) + EMA(yesterday)
C is a smoothing constant where C = 2/(N+1), and N is a number used to approximate a simple moving average. C ranges between 0 and 1. For example, to use an EMA with similar characteristics to a 10-bar simple moving average, use N= 10.
Therefore, C = 2/(10+1) = 2/11 = 0.1818.
The formula for the AMA is:
AMA(today) = SC*(price(today) – AMA(yesterday)) + AMA(yesterday)
Where SC = Scalable Constant
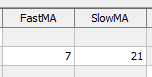
2. and 3. systems based on Exp Ma and Simple Ma S22EXMA S22SMA
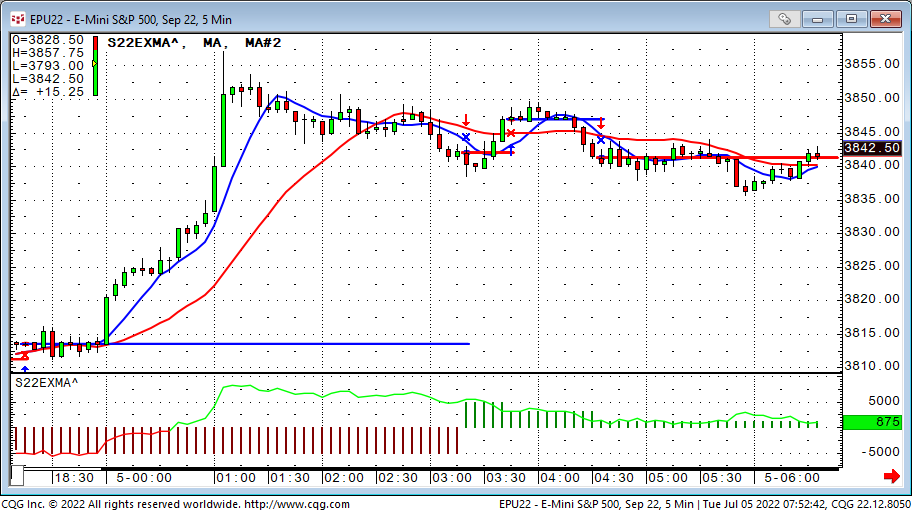
Numbers two and three are simple moving average cross systems. The only difference is the use of exponential moving averages or simple moving averages. The trader triggers when the faster moving average crosses above or below the slower ma.
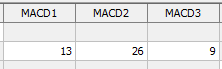
4. MACD System S22MACD
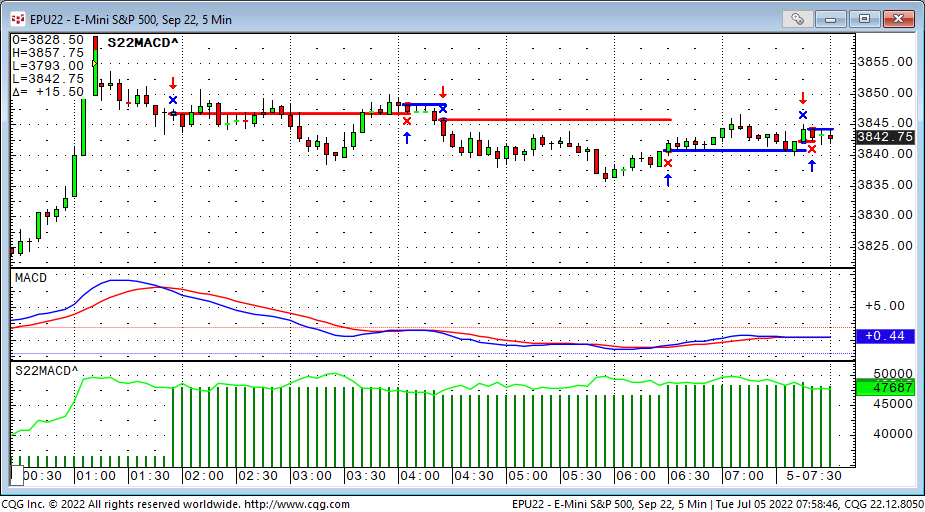
The MACD system triggers the trade when the MACD line crosses above or below the MACDA line.
The MACD is a specific type of OSCILLATOR study. It measures the difference between two exponential moving averages of different lengths, in addition, a trailing moving average of the MACD is plotted (MACDA), this is commonly referred to as the “Trigger” line. The two moving averages have different sensitivities to market action, thereby providing an indication of a change in the market environment, such as the emergence of a new trend or a trend reversal. Gerald Appel defined the MACD with its default parameter values.
Calculation
MACD = Exponential MA1 - Exponential MA2
MACDA = Exponential MA of MACD
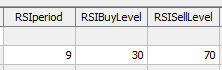
5. RSI System S22RSI
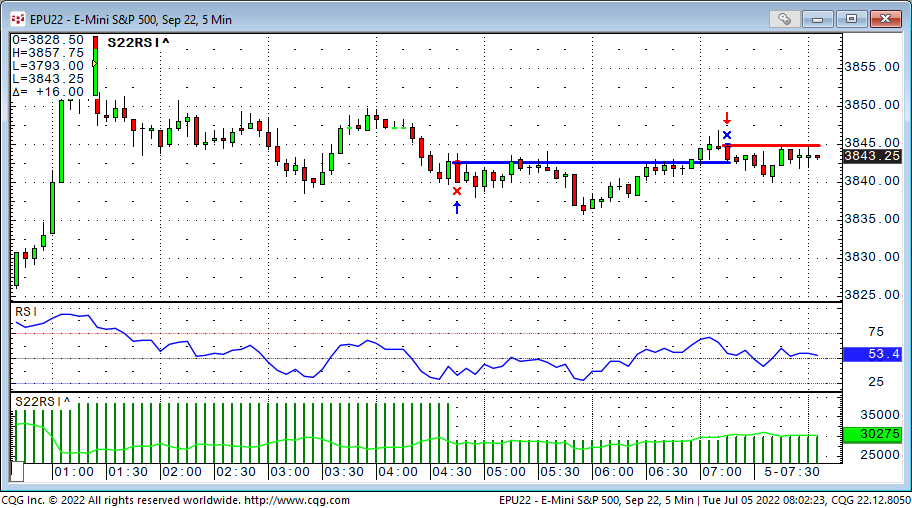
The RSI system triggers a long trade when the RSI crosses above the RSI buy Level and a short trade if it crosses below the RSI sell level.
Relative Strength Index is a price momentum indicator. Mathematically, RSI is represented as:
RSI = 100 - [100/(1+RS)]
where,
RS is the ratio of the smoothed moving average of n-period gains divided by the absolute value (that is, ignoring sign) of the smoothed moving average of n-period losses.
RSI quantifies price momentum. It depends solely on the changes in closing prices. Despite its name, it has nothing in common with the traditional relative strength concept, whereby the price of a stock is divided by a broad market index (such as Standard & Poor's 500 Index) to arrive at a ratio that shows the trend of a stock’s performance relative to the general market. Instead, the RSI is actually a front-weighted price velocity ratio for only one item (a stock futures contract, or an index).
RSI is said to indicate an "overbought" condition when it is above 70 (CQG's default set at 75.00) and an "oversold" condition below 30 (default set at 25.00). The center line default is 50.00.
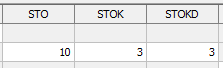
6. Slow Stochastic System S22SSK
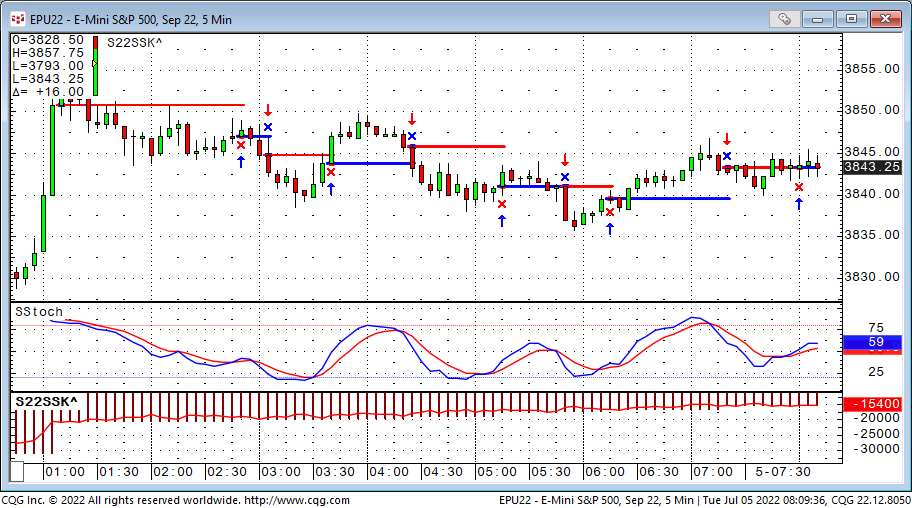
The slow stochastic trading system triggers a trade when the SSK line crosses above or below its trigger line SSD.
When Slow Stochastic is selected, the system internally calculates the Fast Stochastic, however, only the Slow %K and Slow %D lines are displayed on the screen.
Slow %K - Is equal to the Fast %D.
Slow %D - Is a Moving Average of Slow %K values. The default for Slow %D is a Smoothed 3 Period Moving Average.
Users can choose between the Original and the Simple Algorithms. Generally, the simplified will be more responsive to price changes. The formulas for each are:
Original
K:= (MA(Close(@)- LoLevel(@,10),Smo,3)/ MA(HiLevel(@,10)- LoLevel(@,10),Smo,3))*100;
D:= MA((MA(Close(@)- LoLevel(@,10),Smo,3)/MA(HiLevel(@,10)-LoLevel(@,10),Smo,3)),Smo,3)*100;
Simplified
K:= MA(((Close(@)- LoLevel(@,10))/ (HiLevel(@,10)- LoLevel(@,10))),Smo,3)*100;
D:= MA(MA(((Close(@)- LoLevel(@,10))/ (HiLevel(@,10)- LoLevel(@,10))),Smo,3),Smo,3)*100;
7. Parabolic trading system S22PARA
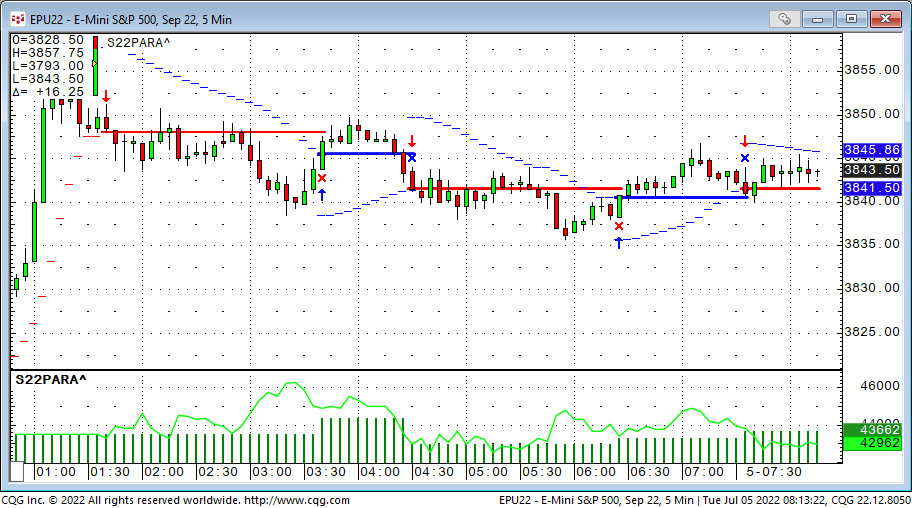
The parabolic trading system triggers a trade when the market crosses the buy (above) or sell (below) lines.
Welles Wilder's Parabolic SAR study is a time/price reversal system. The letters "SAR" stand for "stop and reverse" meaning that the position is reversed when the protective stop is hit.
It is a trend-following system. As prices trend higher, the SARs tend to start out slower and then accelerate with the trend. In a downtrend, the same thing happens but in the opposite direction. The SAR numbers are calculated and available to the user for the following day based on the following equation:

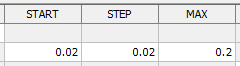
where: AF begins at 0.020 (default value) and is increased by .02 each bar that a new high/low is made (depending on the trend direction) until a value of 0.20 is reached; EP = Extreme Price point for the trade made so far (if Long, EP is the extreme high price for the trade; if Short, EP is the extreme low price for the trade).
Thus, the Parabolic Time/Price System rides the trend until the SAR price is penetrated. Then the existing position is closed out and the reverse position is opened.
8. Volatility Stop System S22VOLS
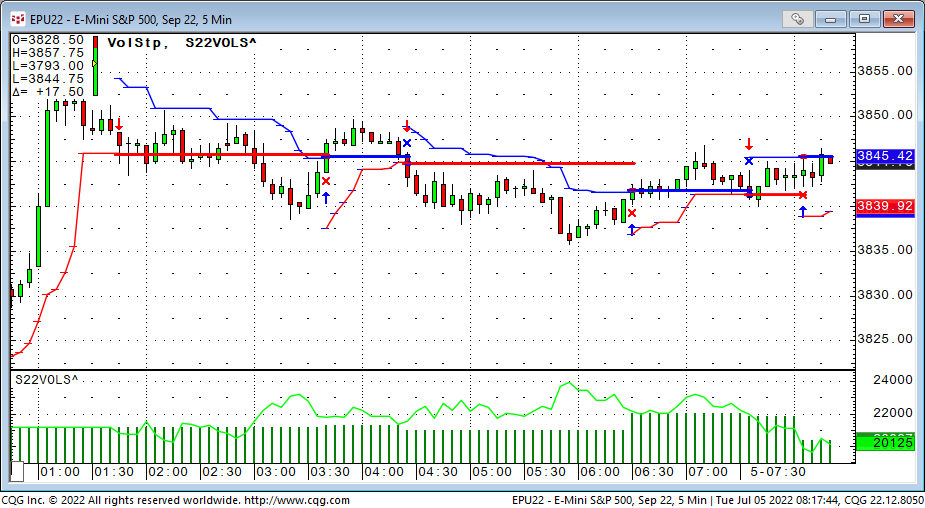
The Volatility Stop trading system triggers a trade when the market crosses the buy (above) or sell (below) lines.
The Volatility Stop study sets stop values based on previous prices and the ranges of prior bars, giving the user great flexibility in calculating stop targets. The stops are calculated by adding the smoothed moving average of the ranges of the previous bars. The system gives sell stops by adding a moving average of the ranges of the previous bars to the lowest close. Likewise, it gives buy stops by subtracting the moving average from the highest close.
Exits:
All trading system in the 8-pack are using the same set of exits:
- EOD - End Of Day will exit any position at the last bar of the day when checked.
- MMstop - Money Management is a simple stop loss. You just need to specify the amount.
- MM - Money Management Stop is on if checked.
- BEFloor - Break Even Exit will close the position when it returns to its entry price. It needs to reach a certain amount of profit (Floor) before it is activated.
- BE - Break Even Exit is on if checked.
- DRTstop - Dollar Risk Trailing is a classic trailing stop that is based on maximum profit during the trade (calculated by each close).
- DRT - Dollar Risk Trailing is on if checked.
- PRTstop - Percent Risk Trailing puts a stop below the maximum profit close to risk x% of the money already gained in the trade. The value is in percent.
- PRTfloor - Percent Risk Trailing needs to reach a certain amount of profit (Floor) before it is activated.
- PRT - Percent Risk Trailing is on if checked.
- PTtarget - Profit Target exits a position if a certain amount of money is gained.
- PT - Profit Target is on if checked.
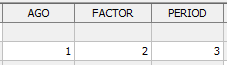
- ATRperiod - Average True Range trailing stop uses the value of the Average True Range study when a trade is initiated. ATRperiod is the length of the ATR measurement.
- ATRfactor - ATRfactor is the parameter that determines how many ATRs the stop is placed away from the market.
- ATR - Average True Range trailing stop is on when checked.
- ES - Entry Stop places an initial stop on the low (for long trades), or on the high (for short trades) of the entry bar. Entry Stop is on if checked.quantity - quantity is the trading size, in contracts, for a stock or future trade.
- FX - If FX markets are traded, the quantity gets multiplied by 100,000. If you want a clip size of 1,000,000 per trade, that is a quantity of ten with FX multiplier checked.