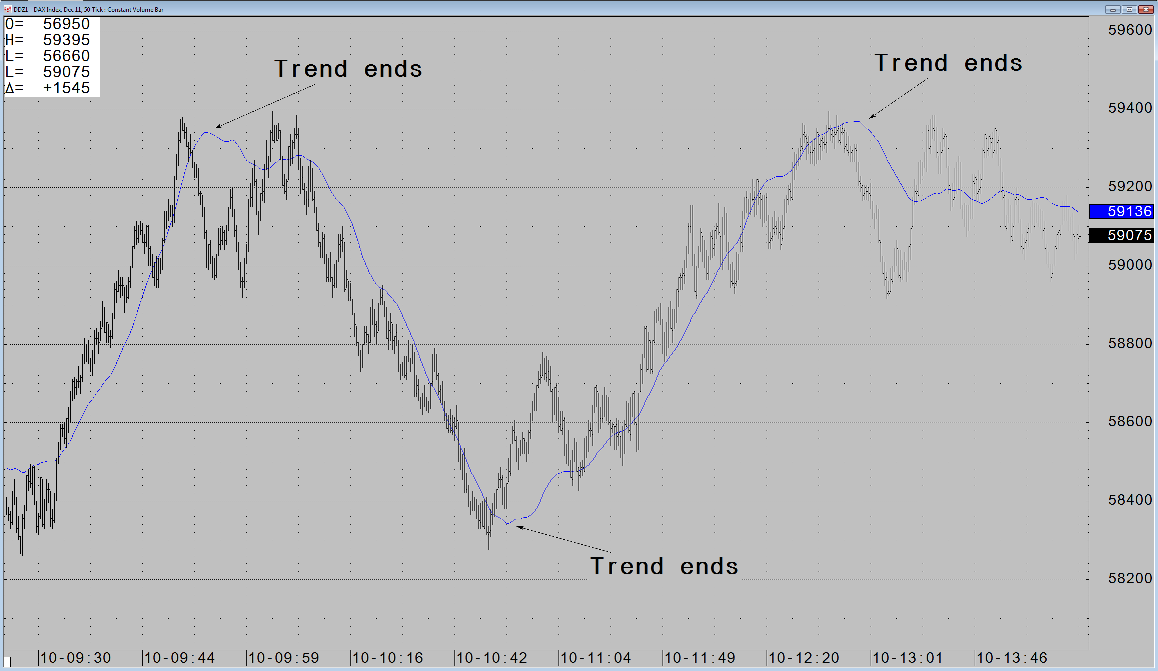
Moving Linear Regression lines are my preferred method for tracking a trend, especially on low time frame charts such as Constant Volume Bars or TFlow®. Regression lines have specific properties that allow them to track the trend however shallow or steep it may be. This is because they build a best fit through the period being tracked, shown below by the Linear Regression lines. This means that the study maintains sensitivity without lag, which is further illustrated on the second chart that compares regression with a standard Moving Average.
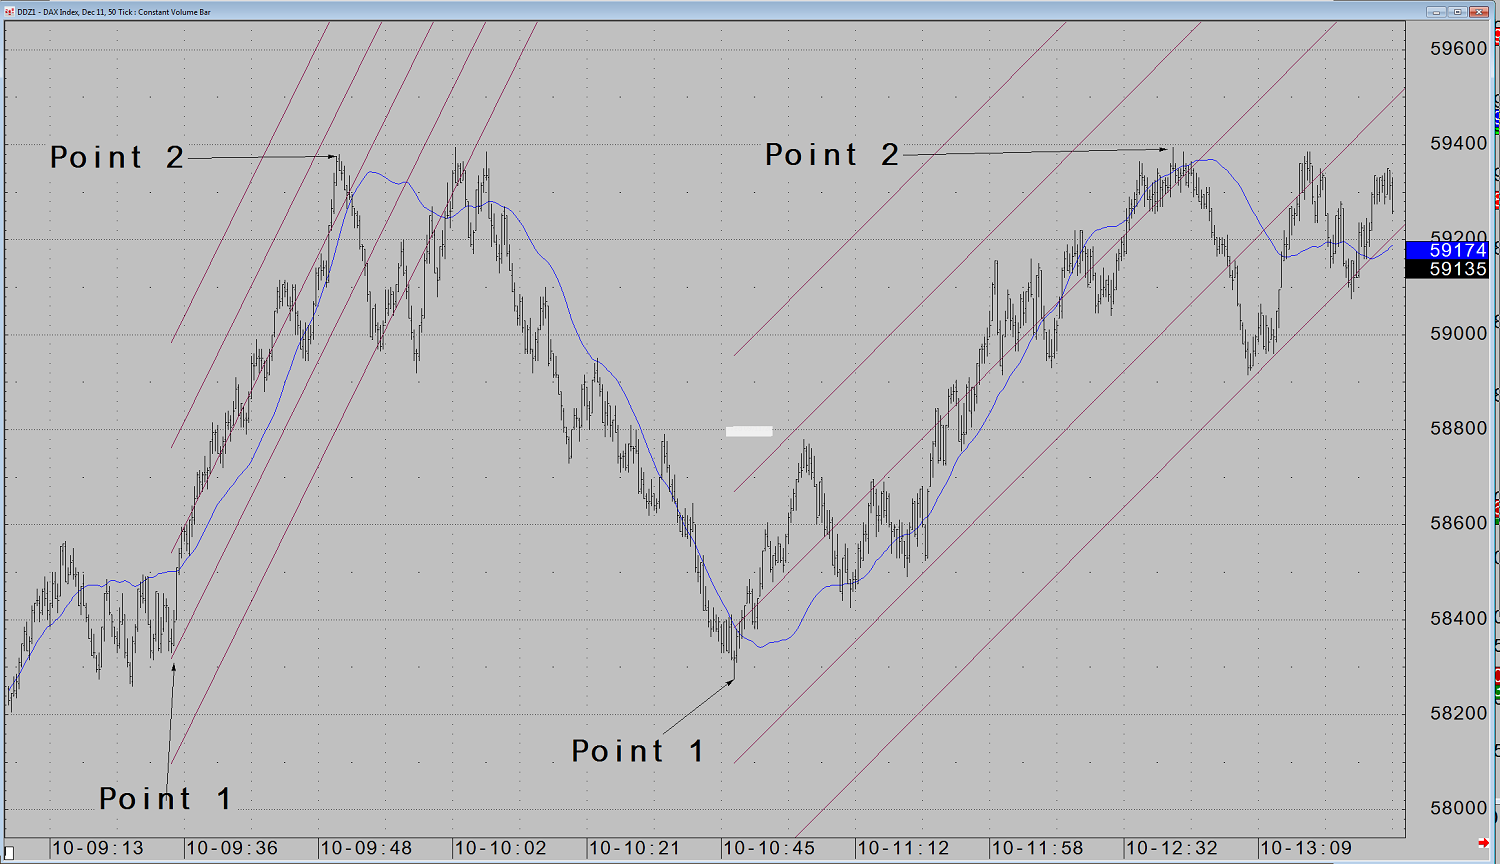

The trend is over when the line changes direction, as shown in the DAX 50-tick constant volume bar chart below. There is one caveat. Due to the fact that the study is, by nature, a best fit, there are occasions when the line can change direction retrospectively. Whilst this is unwelcome, extensive usage over many years shows that these relative, rare occurrences do not impede its overall ability to track a trend and promptly signal its end.
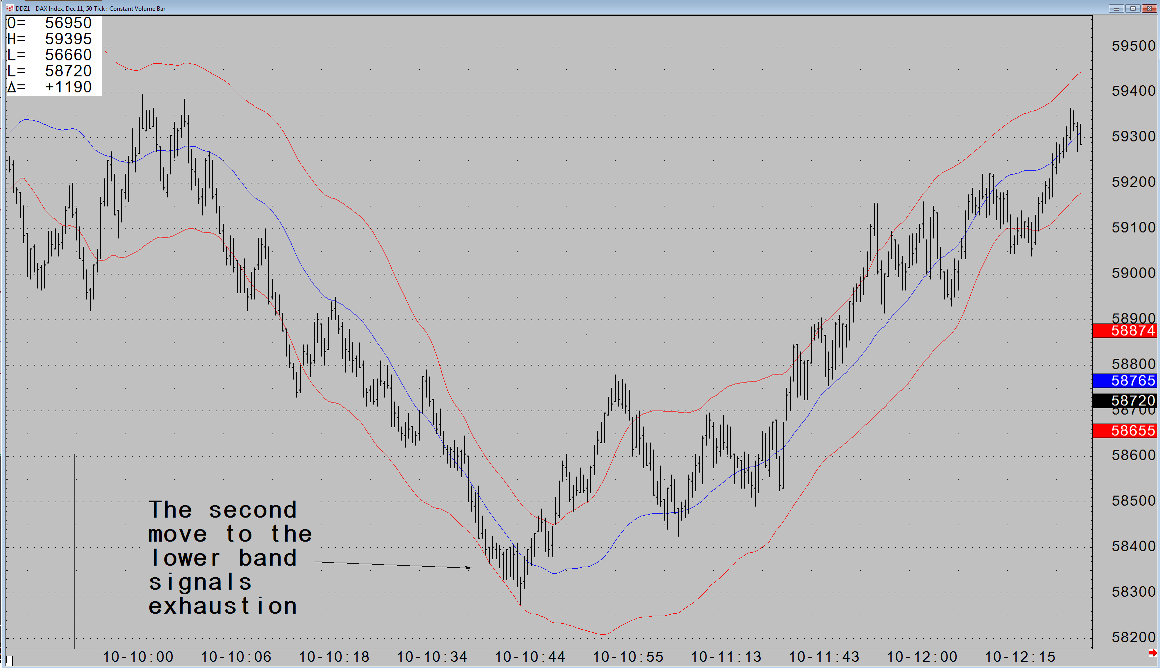
Finally, within the study, it is possible to add three different types of envelopes around the line in order to identify exhaustion points when a trend has developed. These are Factor and Standard Error, Percent, and Factor and Residuals. The first two have similar properties, but the latter creates a narrower band. When using this band, the Factor can be set between 1.7 and 2.5. Exhaustion is flagged when price hits the upper or lower band for the second time in a developed trend.
This has application on TFlow charts as well. The same trend shows a similar exhaustion, but has the added analysis that the DOMTracker has also switched from being bearish to bullish. This is shown by the offer volume traded (red line) moving above the bid volume (green line).
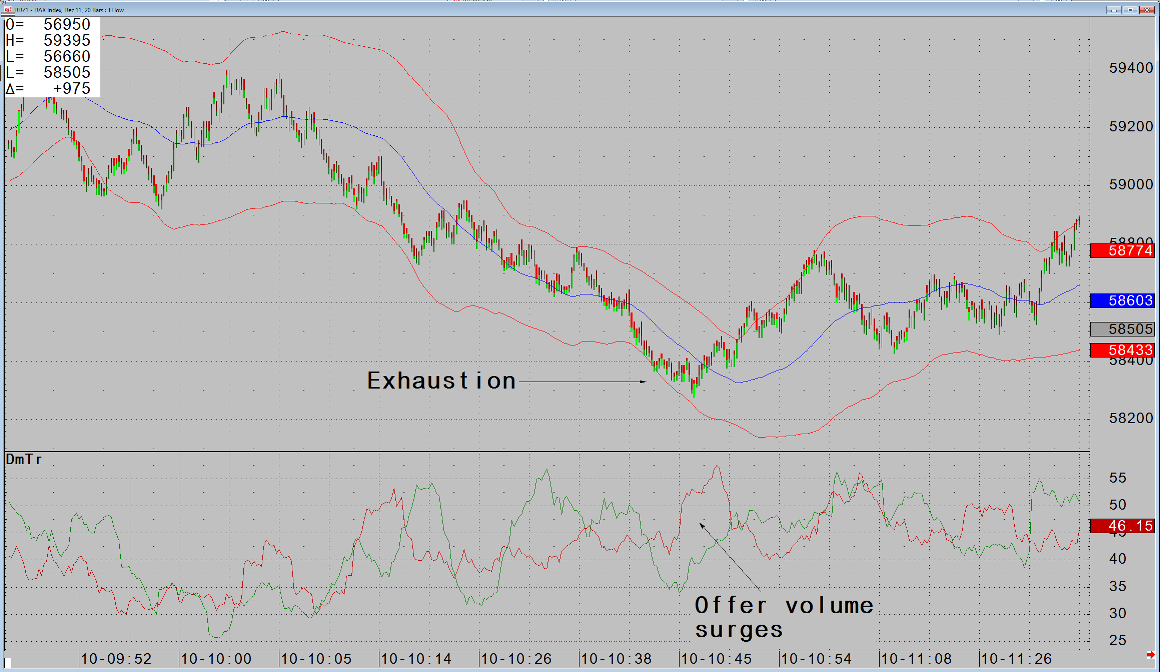
TFlow and DOMTracker theories are already discussed in an earlier set of posts:
