The escalating prevalence in futures of algos and automatic volume-based trading means that it is possible to join the crowd and concentrate on certain methods for specific times of day. My time to trade is severely limited, so it is necessary to develop tools that allow for quick entry and exit, instigated at the most profitable time. This window exists between 1:00 p.m. and 2:00 p.m. London time, when America wakes up. TFlow® and DOMTracker represent an ideal backdrop as they develop based on activity levels. TFlow and DOMTracker settings are identical to what is used in spread trading (read part 1), although the two-period DOMTracker is not necessary. However, I do utilise two additional studies. The first is a custom study called TFCross that can be sent to anyone who uses DOMTracker. This study plots a running sum of the bid and offer volume, with bids plotted in green and offers in red.
The example I am using is the past week's price action in the Bund. The first chart below shows the screen setup and has red squares on the TFlow chart. This is condition-based coding that uses the divergence-based study concepts available in my basic study enablement. The specific code itself is in my advanced package, although anyone can develop or use his or her own trigger points. The concept is as follows and assumes an ability to exit the trade as a profit in three stages. The stop is simply beyond the signal bar.
- The window for a signal is between 1:00 p.m. and 2:00 p.m.
- Any signal must be confirmed by both the DOMTracker and the TFCross.
- Exits are based on the DOMTracker and the TFCross reversing their logic.
- The final exit is either the MLR mentioned in part 1 or Peak Range (not shown here).
- There is a final time-based exit at 4:00 p.m.
So let's consider some important rules and then look at the charts.
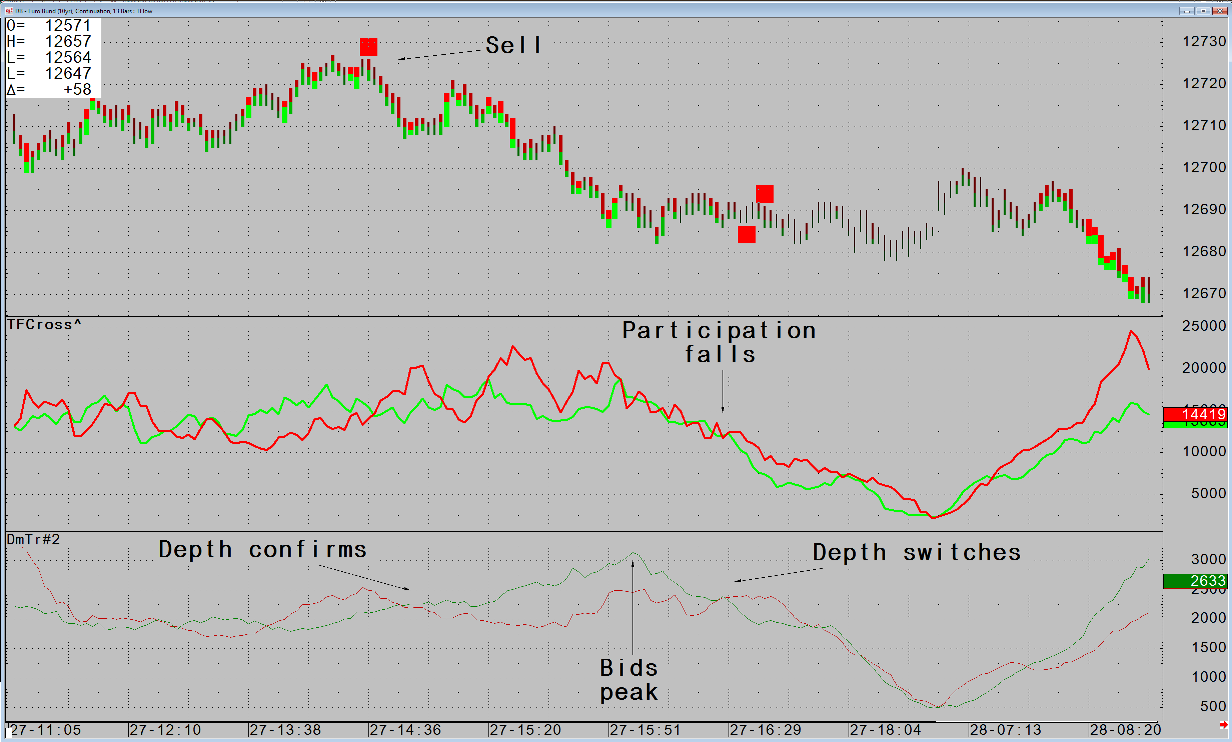
- Rule 1: In order for a sell to be confirmed, the running sum of offer volume (red line) must be above the green. This can already be true or become true shortly after the signal.
- Rule 2: The second confirmation is that the DOMTracker must show that residual bids (green line) are above the red. This suggests a downtrend that is sucking in bids that are below the current price.
- Rule 3: Any reversal of these relationships triggers a partial exit.
The first signal is June 27 and the chart shows that a sell at 12720 has exits between 12690 and 80, as well as the final time-based exit.
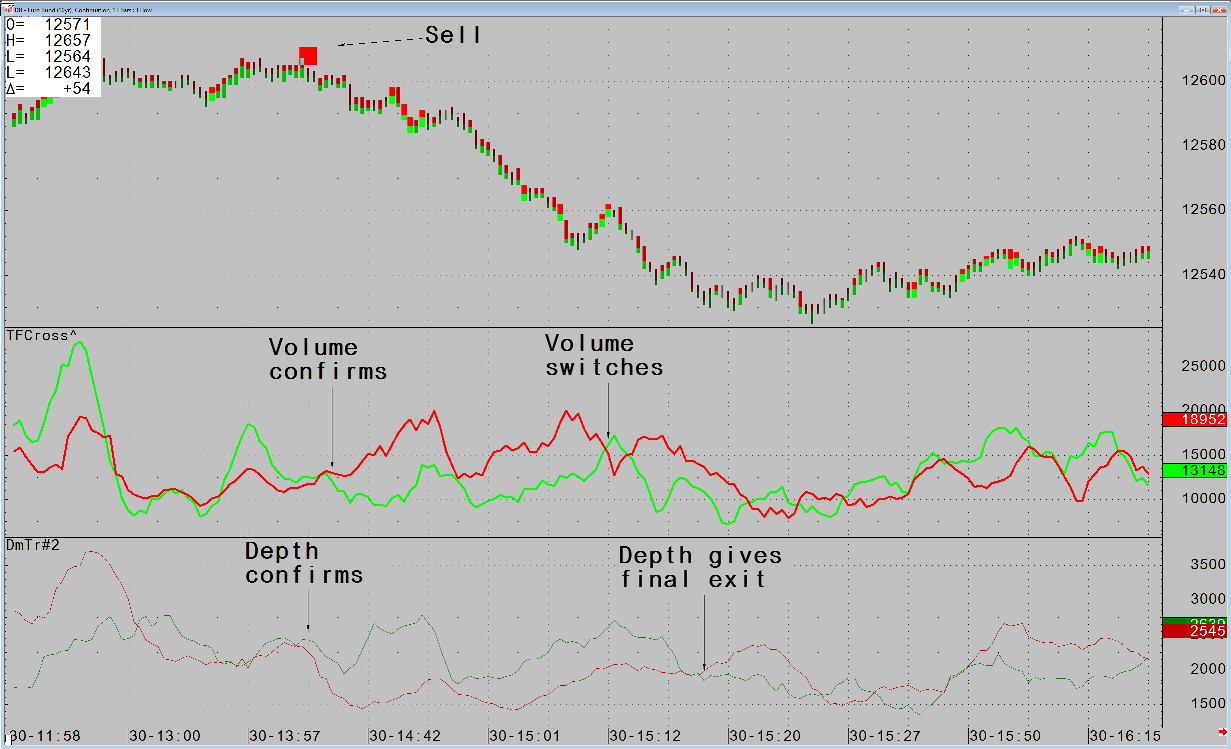
The second chart shows that on June 30, whilst depth was true as soon as the signal appeared, it was a few bars later when TFCross switched and confirmed the trade at 12593. TFCross provided the first exit at 12558 whilst depth gave 12541. The time-based exit was at a similar price.
The third chart on July 1 shows a similar pattern to the previous chart but with a premature exit on the DOMTracker. Volume switches at 12543 from the 12566 entry point, although the DOMTracker reasserts its negative bias and holds the final contract for a further hour with an exit at 12535.

Articles in this series
- TFlow and DOMTracker, Part 1: Their Uses in Spread Trading
- TFlow and DOMTracker, Part 2: Targeting Specific Times of Day to Trade
- TFlow and DOMTracker, Part 3: Redefining Data
