After soaring to an all-time peak in August 2020 in US dollar terms, gold has traded on either side of $1800 per ounce throughout 2021. The yellow precious metal reached a record level in nearly all currencies in 2019 and 2020. Gold was the first member of the commodities asset class to reach record territory; in 2021, copper, lumber, and palladium followed gold to new record highs, with many other raw materials rising to multi-year highs.
Gold is a hybrid as it is a metal with industrial applications and a financial instrument with thousands of years of history as a store of value and means of exchange. Central banks, monetary authorities, governments, and supranational institutions validate gold’s role in the global financial system. They hold the precious metal as an integral part of foreign exchange reserves. While most other reserves are fiat currencies, gold is a hard asset with its supply limited to above-ground stocks. Increasing gold supplies comes from extracting the metal from the earth’s crust.
At the $1800 level at the end of August, gold’s price action has been static. The yellow precious metal is in a coma as it continues to consolidate and digest the August 2020 record high.
One year has passed since gold reached its record high
After making a high of $2063 per ounce in August 2020, gold corrected and has been digesting the move to the new record high.
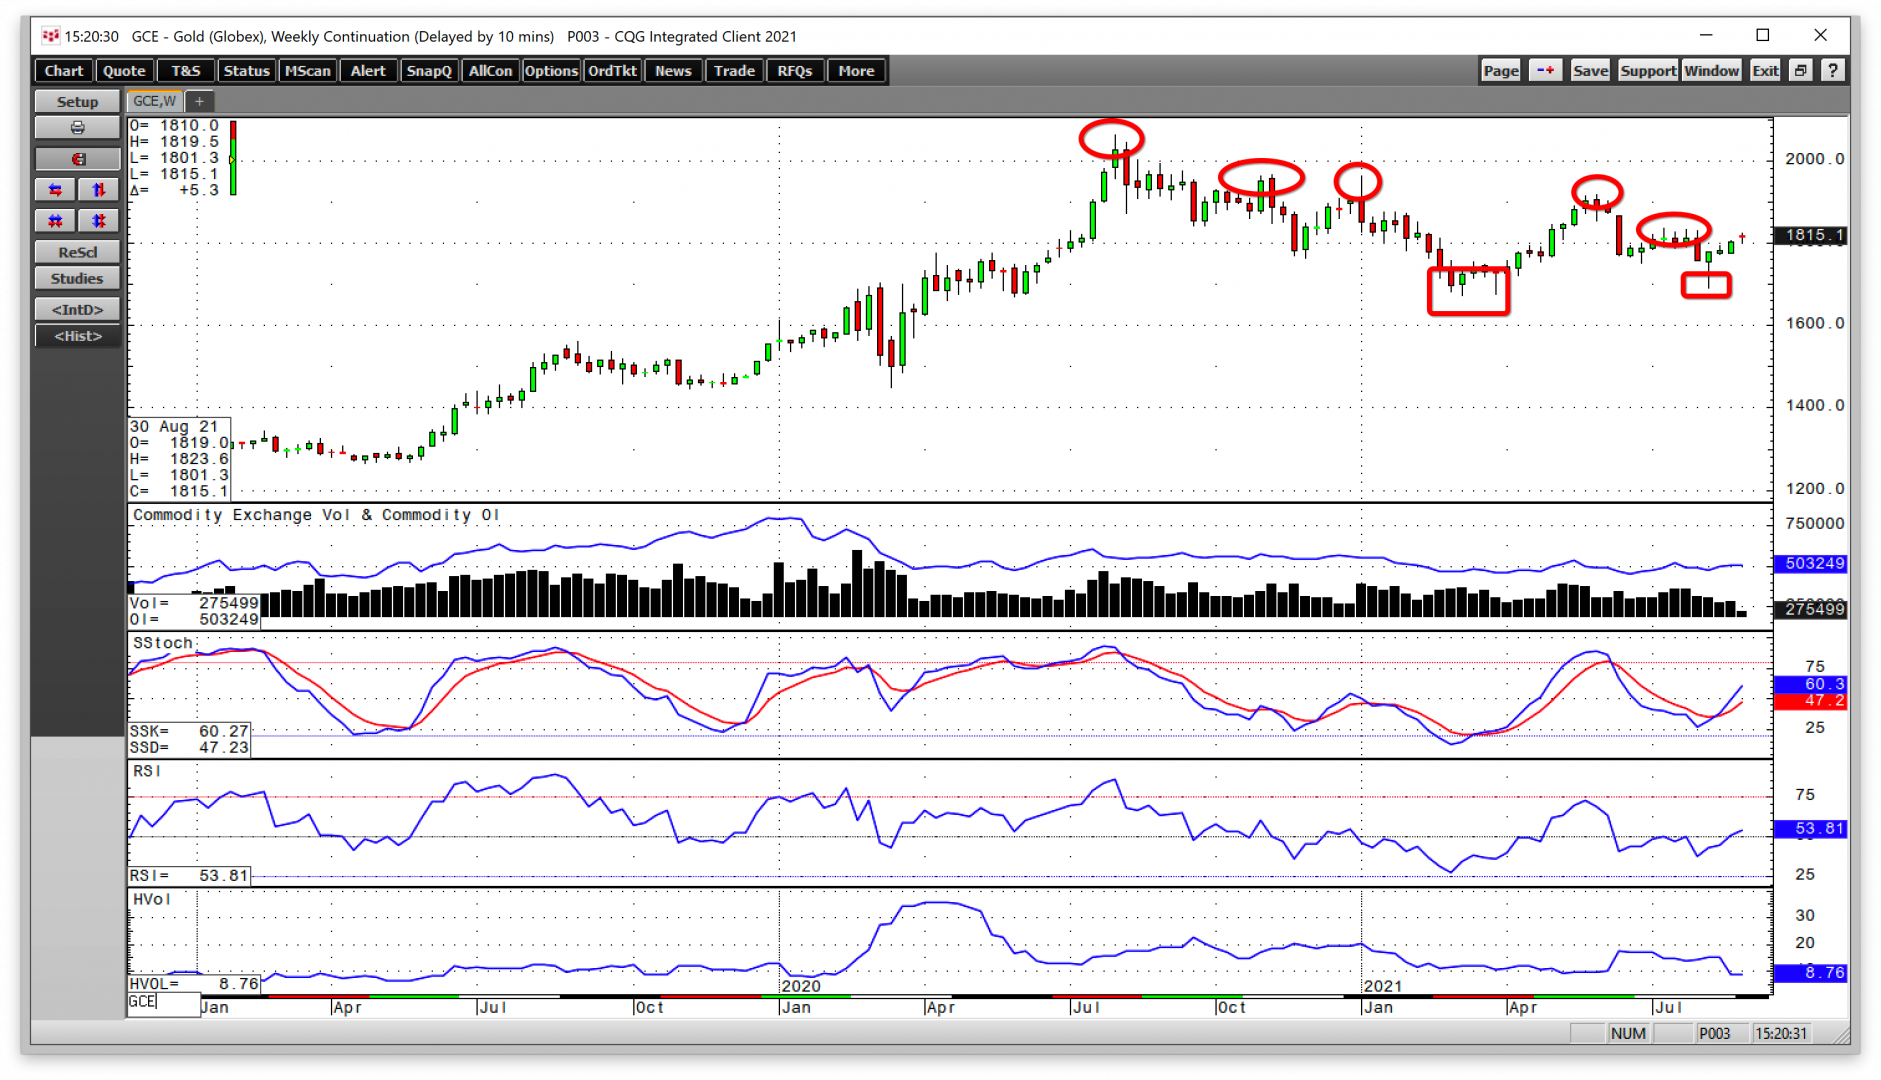
As the weekly chart highlights, gold futures have made lower highs over the past year. However, lows have been higher since gold reached a low of $1673.30 during the week of March 8.
Open interest, the total number of open long and short positions in the COMEX gold futures market was at 550,509 contracts on August 7, 2020, when gold traded to its all-time high. The metric stood at the 503,249 level at the end of August, after falling to just over 450,000 contracts in late June 2021. Declining open interest during price weakness is not typically a technical validation of a bearish trend in a futures market.
Meanwhile, weekly price momentum and relative strength indicators were sitting at just over neutral readings in late August 2021. Weekly historical volatility at 8.76% is at the lowest level since early 2020, reflecting the precious metal’s narrow trading range.
$1800 is the yellow metal’s pivot point
December COMEX gold futures closed at the $1820 per ounce level on August 31, 2021.
As the daily chart illustrations, $1800 has become a pivot point for gold futures since mid-June 2021. Each time the price moved above or below the current pivot point, it has drifted back towards $1800. Since June 17, December futures have traded as low as $1677.90 and as high as $1839 per ounce. At a settle price of $1818.10 on August 31, the price was above the $1758.45 midpoint of the range.
Inflationary pressures have not taken gold to the next level
Over the past months, the consumer price index rose to its highest level in decades, reflecting rising inflation. In late August, Fed Chairman Jerome Powell told markets the central bank would soon begin tapering its quantitative easing program. The Fed has been buying $120 per month of debt securities to keep a lid on interest rates further out along the yield curve. While the conditions are ripe for tapering, the Fed has told the markets they do not foresee any increase in the short-term Fed Funds rate from zero percent any time soon. Tapering QE will not tighten credit as the Fed will continue to buy bonds. Meanwhile, the zero percent interest rate will continue to provide free money and liquidity to markets.
Moreover, the government stimulus will continue with an infrastructure package and budget that includes many stimulative initiatives. While monetary policy gets a touch less dovish, fiscal policies will continue to fertilize inflationary pressures over the coming months and years. So far, rising inflation has not pushed gold higher as it continues to trade on either side of $1800 per ounce.
The dollar index rose to a new high for 2021 - A roadblock for gold
Reserve currency values are a function of interest rate differentials. With a slight pivot towards tightening at the Fed, the dollar index rose to a new high for 2021 in August. The dollar is the world’s reserve currency. As the US currency rises against other world foreign exchange instruments, it tends to weigh on gold’s price.
The dollar index has made higher lows and higher highs throughout 2021, reaching its most recent peak at 93.75 on August 20, a new high for 2021 and the highest level since November 2020. The dollar index traded in a range of 91.99 to 93.98 in August 2020. In August 2021, the range was from 91.82 to 93.75. Meanwhile, the dollar was trending lower in August 2020 and higher during the same month in 2021, which has likely weighed on the yellow metal.
Bull markets rarely move in a straight line. New record highs tend to lead to a correction and period of price consolidation.
Every dip for over two decades has been a buying opportunity
Gold’s bull market began around the turn of this century. In 1999, the price traded to a low of $252.50 per ounce on the nearby COMEX futures contract.
The chart shows that gold has made higher lows and higher highs over more than two decades. At the $1818.10 level at the end of August 2021, gold was still 7.2 times the price at the 1999 bottom.
Over more than two decades, every pullback in the gold market has been a buying opportunity. As inflationary pressures continue to rise, eroding the value of all fiat currencies, the bullish trend is likely to continue. Gold may be in a coma after correcting from the August 2020 high, but the odds of continuing the bullish trend remain high. I expect we will see new highs in the yellow metal over the coming months.