The raw material markets asset class moved higher in the fourth quarter of 2021 after posting gains throughout the year. The commodity asset class consisting of 29 of the primary commodities that trade on US and UK exchanges moved 4.73% higher in Q4 than the level at the end of September and was 26.79% above the level for the year that ended on December 31, 2020. In 2020, the asset class moved 9.89% higher. In 2019 it gained 10.98%, but in 2018 the asset class lost 6.82% of its value.
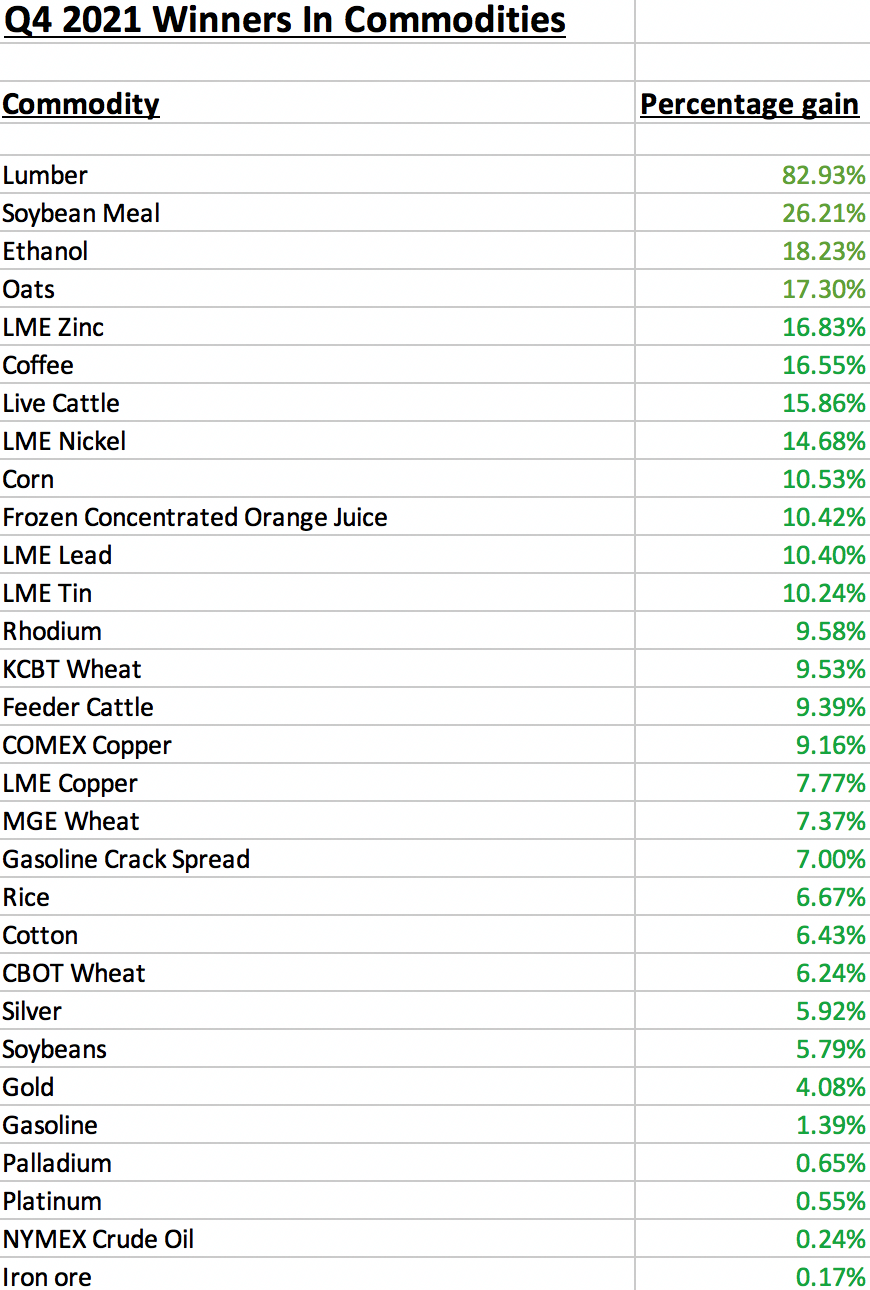
The overall winner of the 29 for the fourth quarter was the lumber market that posted a gain of 82.93% in Q4 as the illiquid commodity recovered from a low of $488 in August.
Soybean meal futures came in second place with a 26.21% quarterly gain as soybeans corrected from multi-year highs and consumers bought meal. Ethanol, the biofuel, was the third-leading market, posting an 18.23% price increase since September 30, 2021, as US energy policy favors alternative and renewable fuels. The biggest loser in the composite for the quarter was the natural gas futures market that fell 36.42% after the price rose to a multi-year high at $6.466 per MMBtu in October before turning lower. Lean hog futures were the second worst-performing commodity with an 11.05% loss in Q4. Sugar corrected 7.18% lower over the final quarter of 2021.
Coal for delivery in Rotterdam, the Netherlands, fell 46.31% after reaching a record high in October. The Baltic Dry Index dropped 55.32% as seasonal factors during the winter months weighed on freight rates.
There were lots of double-digit percentage gains in Q4. Two markets were over 20% higher, and ten gained 10%-20% percent. Four markets posted double-digit percentage losses during the quarter. Winners edged out losers in the fourth quarter of 2021 by a margin of 30 to 11.
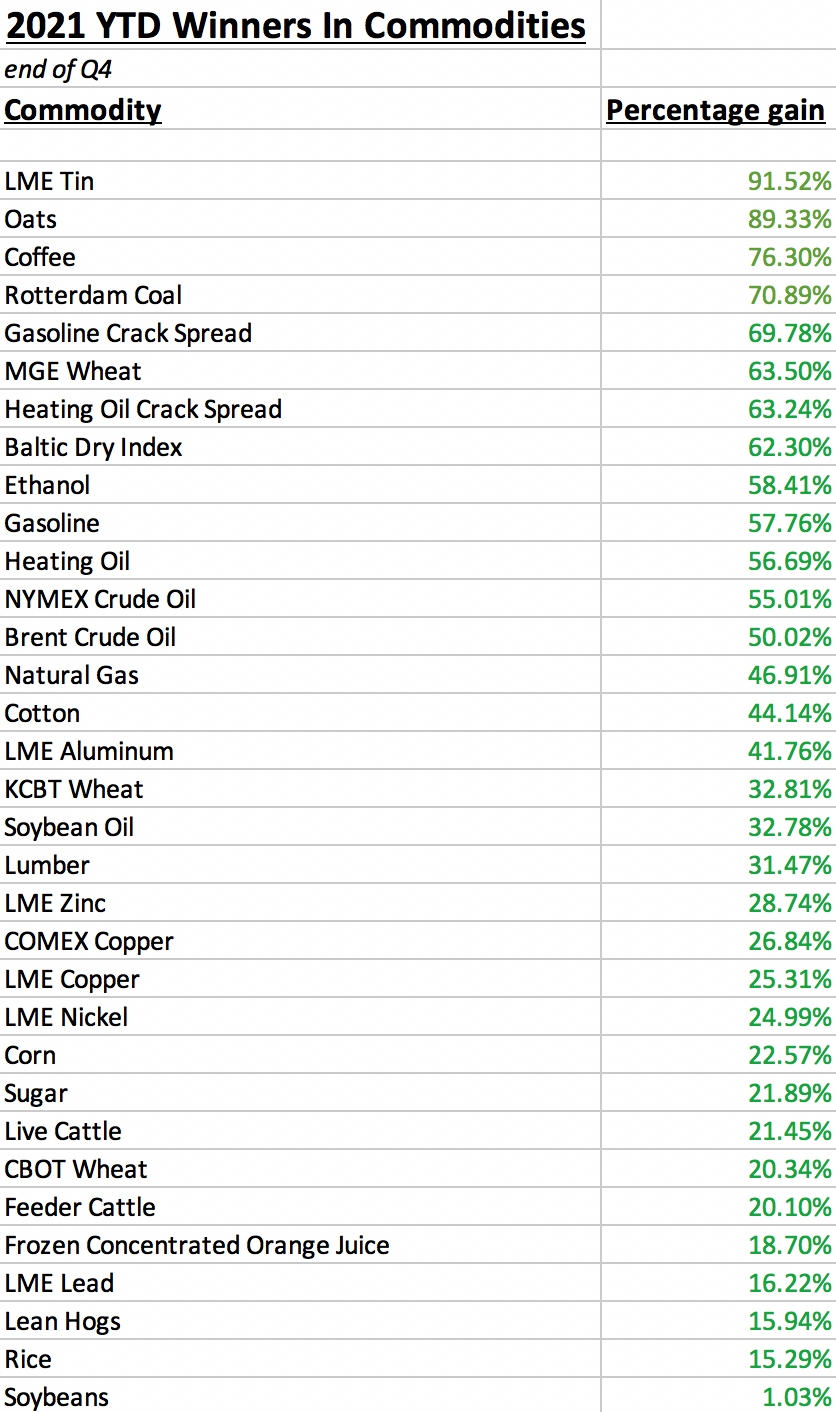
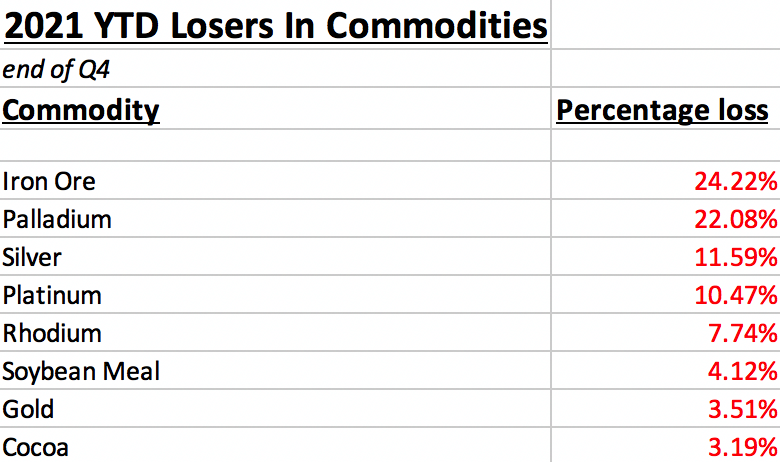
In 2021, 33 commodities posted gains, while eight moved lower from the price level on December 31, 2020.
The US dollar is typically a significant factor for commodity prices, as it tends to have an inverse value relationship with raw material prices. The dollar index rose 1.44% in Q4, pushing the index 6.34% higher in 2021. The dollar index was 0.34% higher in 2019 after moving 4.26% higher in 2018, which followed a 10.23% decline in 2017. The dollar rallied in Q3 and Q4 on the back of the prospects for higher US interest rates. US 30-Year Treasury bond futures edged 0.39% higher in Q4 but was 7.53% lower in 2021.
Five of six sectors of the commodity asset class rally in Q4
Base metals led on the upside in Q4 as the sector gained 9.65% and were 38.09% higher in 2021. In 2021, energy commodities gained 54.13% despite a 3.02% loss in Q4, making it the worst-performing sector for the quarter. Grains posted a 9.31% gain in Q4 and a 29.71% increase in 2021.
Animal proteins moved 4.73% higher in the fourth quarter as cattle gains were greater than losses in the hog futures market. The meats moved 19.16% higher in 2021. Soft commodities were 4.25% higher in Q4 and moved 31.57% higher in 2021.
Precious metals gained 2.80% in Q4 but were the worst-performing sector of the asset class in 2021, with an 11.91% loss for the year. The rising dollar and prospects for higher interest rates weighed on precious metals. Supply chain bottlenecks affecting semiconductors and automobile manufacturing weighed on platinum group metals as demand declined. Platinum, palladium, and silver prices suffered double-digit percentage losses for the year.
Five of six sectors of the commodities asset class rallied in Q4. Five of six moved higher in 2021, with precious metals the only losing sector this year.
Winners in Q4 and 2021
Thirty commodity markets moved higher in Q4 2021.
The overall trend in the asset class remained bullish after moving higher each quarter starting in Q2 2020. In 2021, the following 33 commodities posted gains:
Meanwhile, the stock market made new highs in Q3 and Q4 and ended on a bullish note. In Q4, the DJIA was 7.37% higher, the S&P 500 moved 10.65% higher, while the NASDAQ gained 8.28%. In 2021, the DJIA was 18.73% higher, and the NASDAQ moved 21.39% to the upside. Ironically, the commodities futures composite gained 26.79%, and the S&P 500 was 26.89% higher. Inflation was likely a factor that lifted stock prices in 2021.
Meanwhile, Bitcoin, Ethereum, and digital currencies experienced parabolic rallies in Q1 and Q2, taking prices to all-time highs and the market cap to over the $2.4 trillion level before the parabolic move imploded and the two leading cryptocurrencies halved in value from the April and May 2021 highs. In Q3, the top cryptos and overall market cap moved higher. In Q4, cryptocurrencies reached a new record high on November 10, put in bearish reversals on the daily charts, and corrected lower. Bitcoin was still 5.41% higher in Q4 and 57.81% higher in 2021. Ethereum gained 21.68% in Q4 and was 391.75% higher than the closing price on December 31, 2020, on December 31, 2021. The market cap at the $2.166 trillion level was 12.50% higher on a quarter-by-quarter basis. The overall value moved 182.18% higher in 2021. Bitcoin underperformed while Ethereum outperformed the asset class as market participants view Ethereum as a faster and more efficient blockchain with more utility.
Losers in Q4 and 2021
Eleven markets moved lower in Q4.
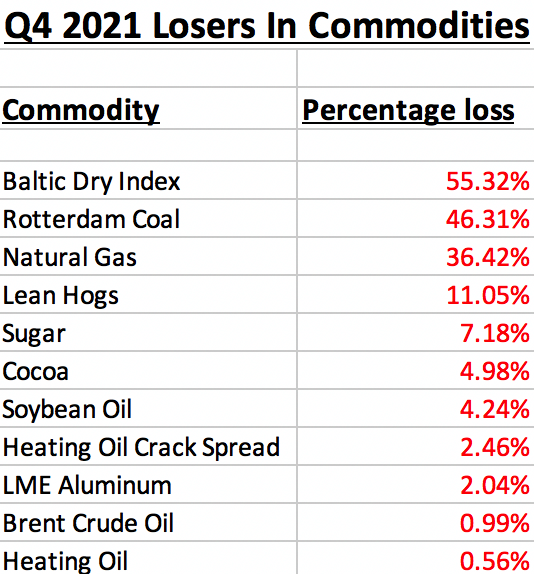
Four commodities lost over 10%. Winners beat out losers in Q4 by nearly 3:1.
In 2021, winners outnumbered losers by a 4.125:1 margin as the bull continued to charge higher in the commodities asset class.
The rally in commodities has been nothing short of a bullish relay race to higher prices, with one raw material market handing the bullish baton to another. In Q4, the base metals and grains sectors took the baton as each posted an over 9% sector gain.
Highlight on lumber and natural gas
Lumber was the leading commodity in Q4 after a year of head-spinning volatility. Before 2017, lumber had never traded above the 1993 $493.50 per 1,000 board feet all-time high.
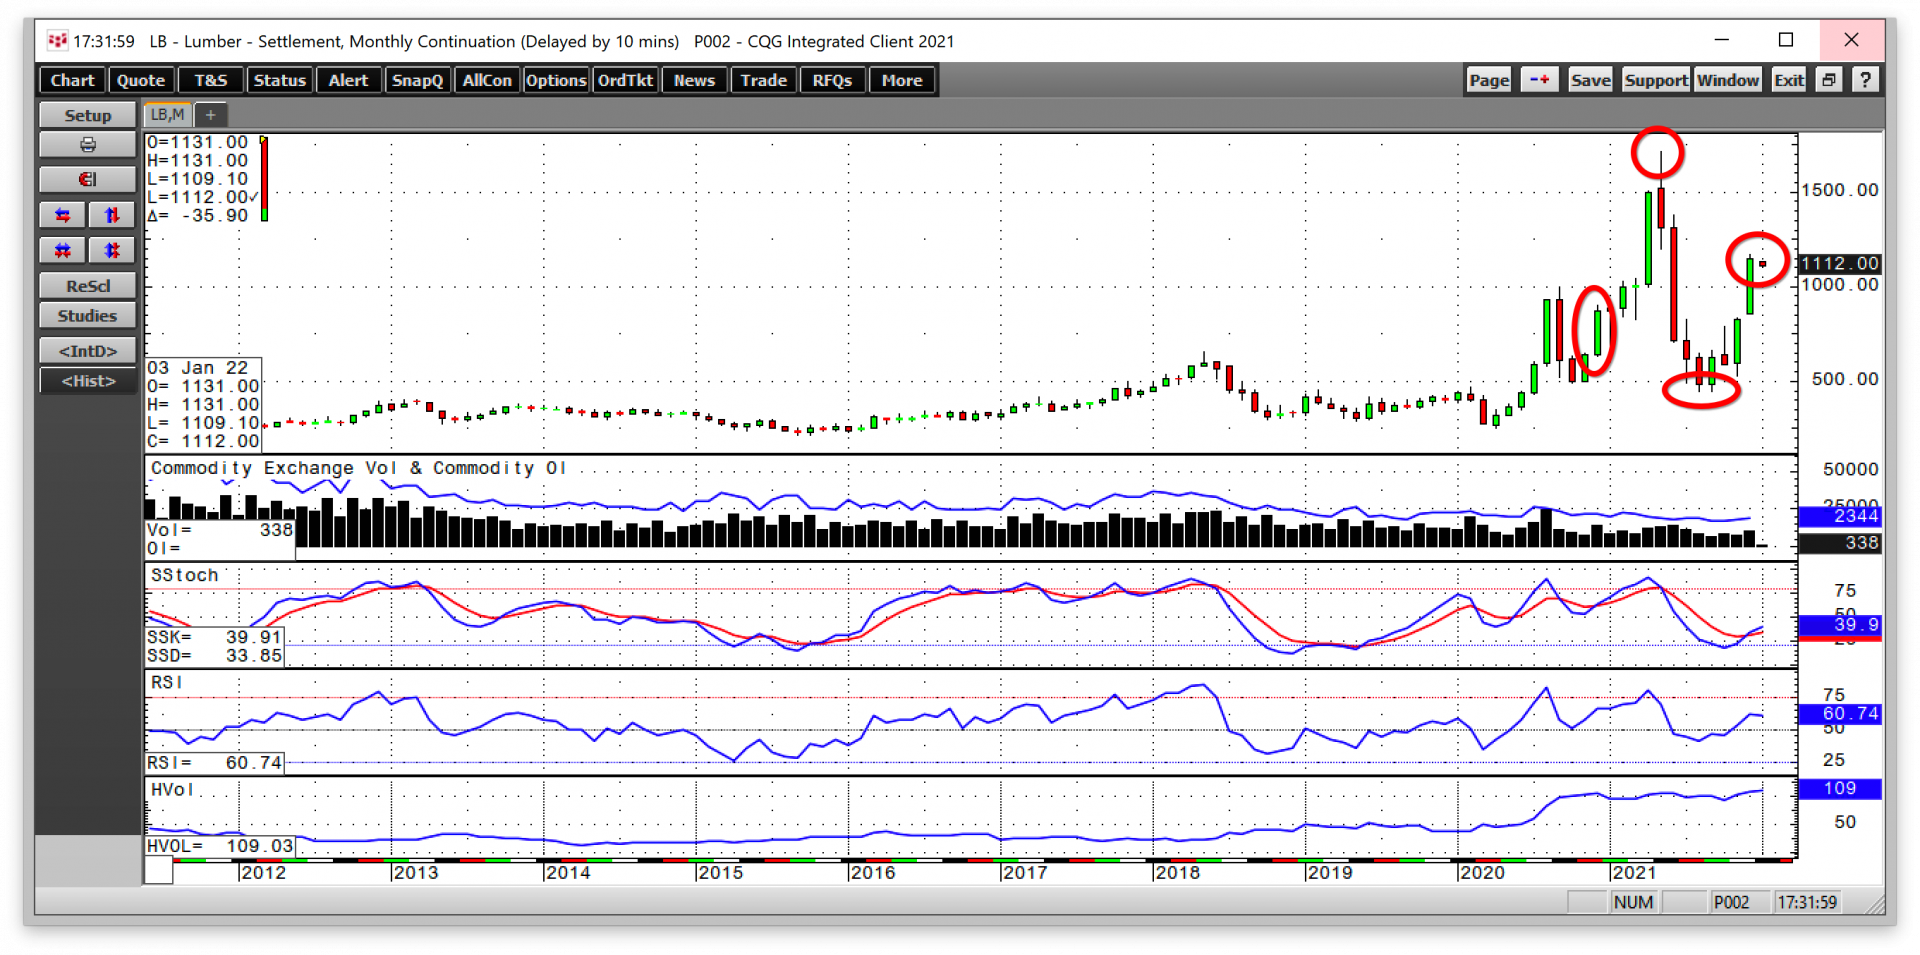
The chart shows that lumber futures closed at the $873.10 level on December 31, 2020, rallied to a record high of $1711.20 in May 2021, before falling to under one-third that price in August when it found a bottom at the $488 level. Lumber futures rejected the August low and rallied to close at the $1147.90 level on December 31, 2021, up 82.93% for the quarter and 31.47% above the 2020 closing price. Lumber is a highly illiquid futures market with a total open interest of only 2,344 on December 31, and the average daily volume is around 500 contracts. Illiquid markets tend to magnify price action on the up and downsides as bids and offers often evaporate during price moves. While lumber is virtually untradeable, it is a benchmark for industrial demand and often moves before other industrial commodities prices, making it a bellwether commodity. At the end of 2022, lumber’s price action was telling is three things:
- The robust demand for new homes is likely to continue as buyers rush to make purchases before interest rates move appreciably higher.
- US infrastructure rebuilding will likely require more lumber over the coming months and years.
- Inflation continues to rise, and supply chain bottlenecks are impacting supplies.
Lumber was far and away the leader on the upside in Q4, with soybean meal a distant second, posting a 26.21% quarterly gain.
Natural gas is a highly volatile market. In Q3, the price rose by over 60%, and the energy commodity made a higher high in early October when it reached $6.466 per MMBtu, coming within 2.7 cents of the February 2014, $6.499 per MMBtu high.
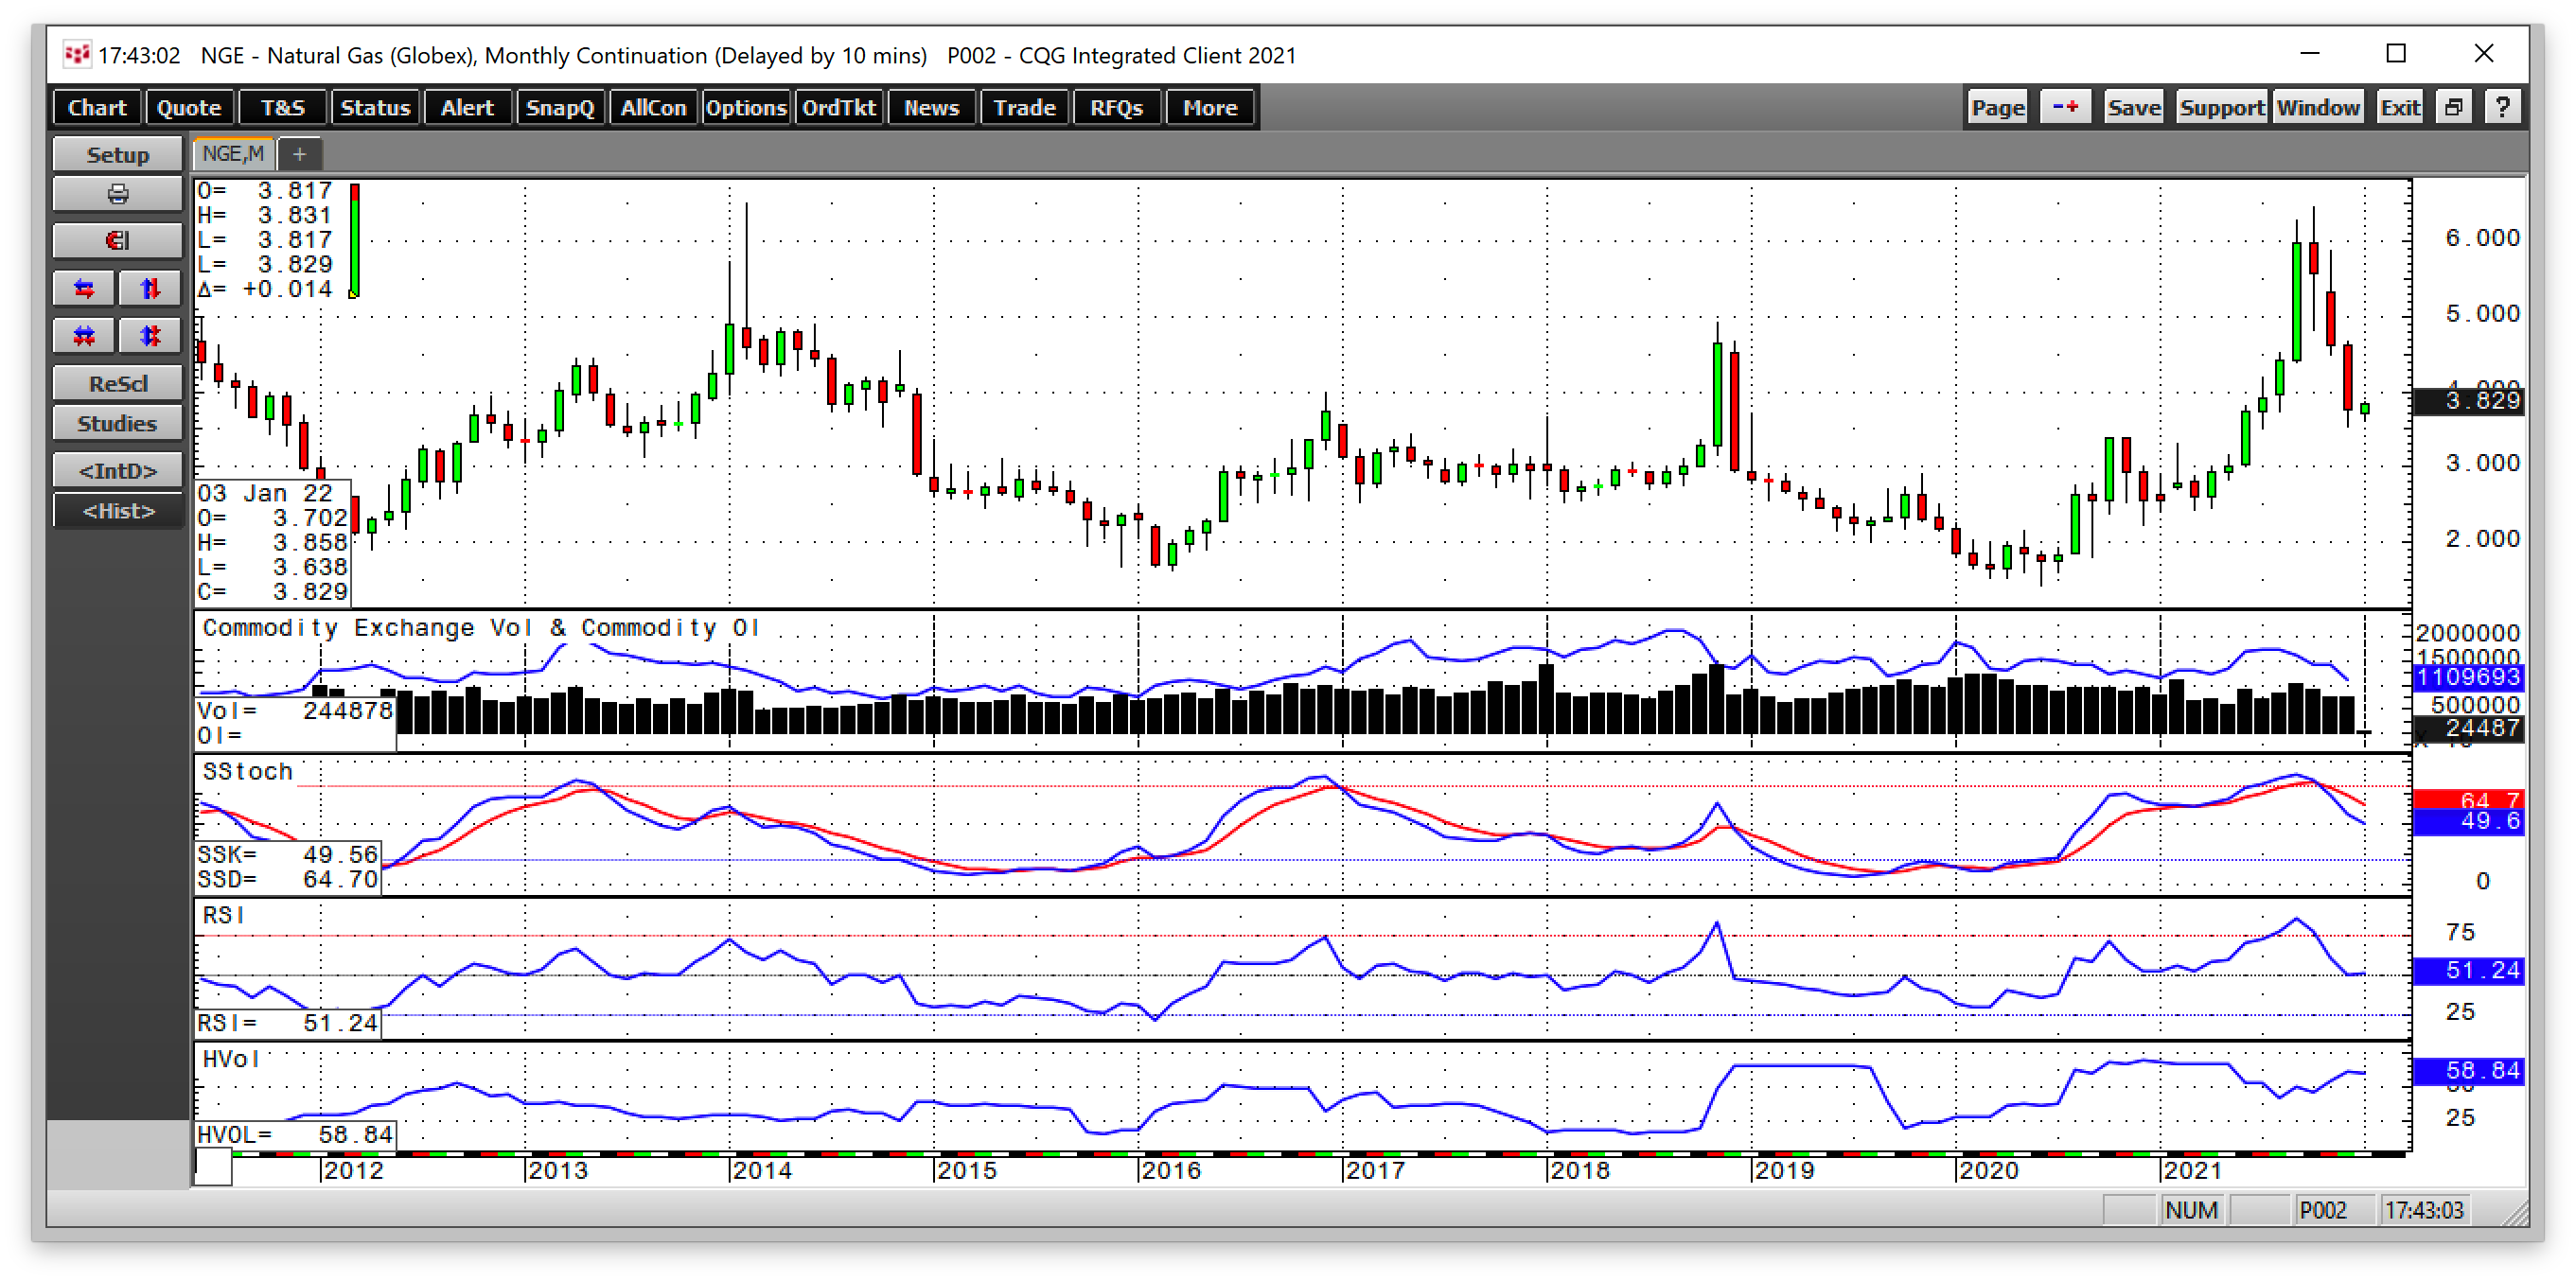
The monthly chart highlights the carnage in the natural gas market that took the price lower during three consecutive months in Q4 and to a low of $3.536 per MMBtu. Natural gas futures fell 36.42% in Q4 during the withdrawal season. However, the energy commodity was still 46.91% in 2021 at the closing price of $3.73 per MMBtu on December 31, 2021.
Natural gas reached an unsustainable level as warm weather in the US and Russian natural gas flows to Europe caused foreign prices to decline. However, at the end of 2020, the price was sitting at $2.539 per MMBtu, nearly 47% below the price on December 31, 2021. The demand for US LNG continues to rise, which is likely to lead to higher lows for the energy commodity in 2022 compared to the past years.
Inflation is not going away anytime soon
As we head into 2022, the US Fed finally abandoned the term “transitory” when referring to inflation. The following factors mean that inflation will remain a clear and present danger over the coming months, and perhaps years and other factors will cause volatility in markets across all asset classes in 2022:
- Real rates will remain negative in 2022 and 2023. The FOMC projected a 0.90% Fed Funds rate in 2022 and a 1.6% rate in 2023. If inflation remains steady or even slightly recedes, real interest rates will be negative in the coming years. Negative interest rates create inflationary pressures.
- Inflation is a vicious cycle. As inflation lifts wages and input prices, businesses charge more for products. The central bank remains behind the inflationary curve. Treating inflation requires a dedication to higher interest rates to cool off price gains. A cautious approach allows the inflationary snowball to continue rolling down the hill, gaining size and momentum. Inflation should continue to be a problem in 2022.
- The treatment is not politically desirable. There is little appetite for a hawkish approach to monetary policy during an election year. Voters tend to choose representatives and leaders based on their pocketbooks. Higher taxes and rising interest rates that slow or reverse economic growth will likely cause the current administration to lose majorities in the house of representatives and Senate in the 2022 mid-term elections.
- The mid-term elections will determine the US domestic policy path until the 2024 presidential contest. Relations with Russia and China continue to deteriorate. Inflation remains a clear and present danger in the US and worldwide. Markets reflect the political and economic landscapes. Expect lots of volatility in markets across all asset classes in 2022, and you will not be disappointed.
The unforeseen events that occur always tend to move markets the most. No one saw the worst pandemic in a century coming at the end of 2019, and the next issue that shocks the markets will likely appear out of the blue. Fasten your seatbelts for a bumpy ride. Commodities rose by 26.79% in 2021, and the overall bullish trend remains intact as we head into 2022.