Moving averages, oscillators, forward curves, spreads, basis graphs... charting can seem overwhelming to commercial hedgers who are simply seeking to dampen volatility and lock in profits on their physical production and/or consumption. In this first in our series of articles for commercial hedgers, I'll try to outline what we feel are the most essential (and simple) aspects of charting for commercial hedgers.
First Things First: What are Support and Resistance?
You can think of support as a floor, preventing the market from going lower and resistance as a ceiling that thwarts the market's rise. We feel that, "in general", commodity markets (unlike equities) tend to be mean reverting with a minor upward bias over a long period of time. As a result, long-term support and resistance levels are probably the single most important tool for commercial hedgers to understand.
As you can see in Figure 1 (see below), over the course of the past fifteen years, $16.00/bushel for Soybeans has proven to be a "resistance" level, and a good spot for producers to aggressively hedge, while $8.00/bushel has been a solid "support" level, and an excellent area for consumers to aggressively hedge. With these levels in mind, a commercial hedger can, "fine tune" their hedge, with producers being less and less aggressive as the market gets closer to $8.00 and more aggressive in approach of $16.00.
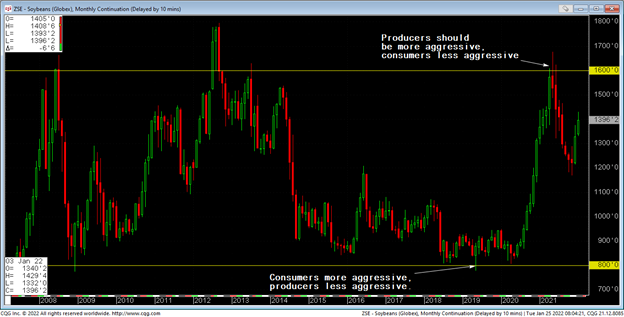
Figure 1 - Monthly CME Group Soybean Futures (2007-Present)
Don't Forget About the Fundamentals
Although we specialize in technical analysis for commercial hedgers, we are always monitoring the fundamentals because it is possible for a commodity to experience a "paradigm shift" in supply/demand and this can cause the asset to shift from prior support/resistance levels to new levels (sometimes for many years).
This is precisely what happened in the Crude Oil market. Throughout the 1990s and the early part of the 2000s, the long-term resistance was $35.00/barrel and long-term support was $15.00 (see Figure 2 below).
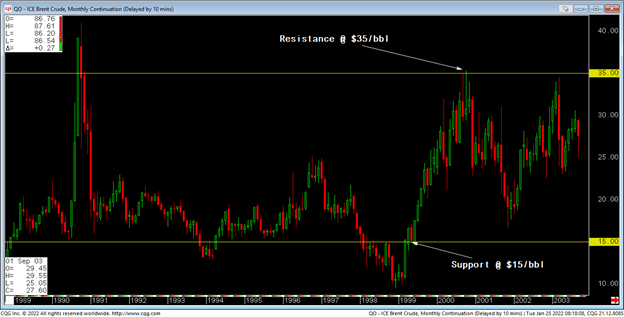
Figure 2 - Monthly ICE Brent Crude Oil - Support and Resistance in the 1990s.
However, these support and resistance levels changed in the 2000s due to a paradigm shift in supply-demand dynamics in the Crude Oil market (specifically increased consumption from emerging markets like China). This paradigm shift led to a long-term change in support and resistance levels in the Crude Oil market and $35.00/barrel (which was resistance in the 1990s), became support and the $120.00/barrel area became the new resistance level in Brent Crude Oil (see Figure 3 below).
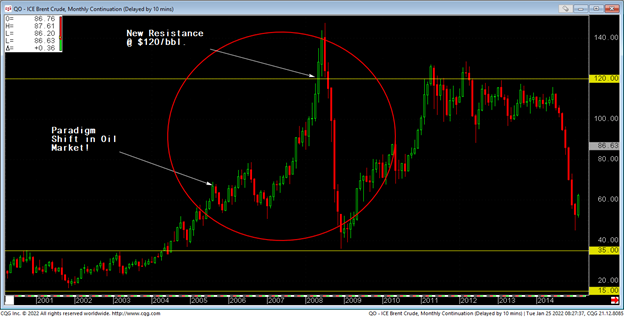
Figure 3 - Monthly ICE Brent Crude Oil (2000-2014)
Putting It All Together
Although the possibility of a paradigm shift makes hedging with charts more challenging, we still believe using long-term support and resistance levels to determine how aggressively we should hedge represents a huge edge for commercial hedgers in today's commodity markets. If you'd like to see how we use technical analysis to develop a rule-based, active hedge program visit our website: https://weissmanconsulting.com/the-technical-hedger