In this second of our series of articles on technical analysis for commercial hedgers we will look at using technical analysis to understand the basis and how it impacts the decision-making process for commercial hedgers.
What is the Basis?
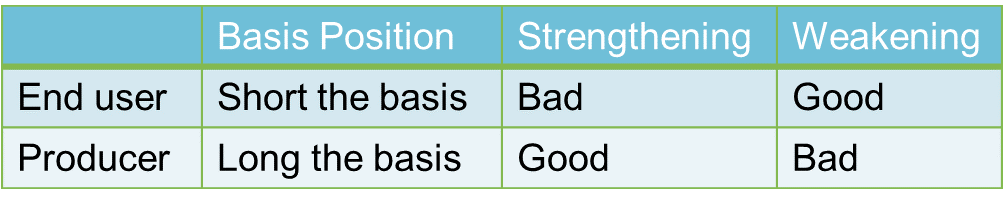
Basis is the spot price minus the (standardized) futures contract price. So, basis could be for the spot price at a different location than the futures delivery location (such as #2 Yellow Corn at Central City, IA as opposed to Burns Harbor IN/Chicago IL) or a different quality (such as a Heavy Sour Crude Oil like Western Canada Select as opposed to the futures contract delivery grade of Light Sweet WTI Crude Oil). That stated, even if the quality and location are the same, commercial hedgers are still taking on calendar basis risk when they hedge with futures (because by definition the futures contract represents the commodity’s value on a future delivery date). Figure 1 (shown below) helps commercial hedgers understand whether a strengthening or weakening basis is “good” or favorable for them.
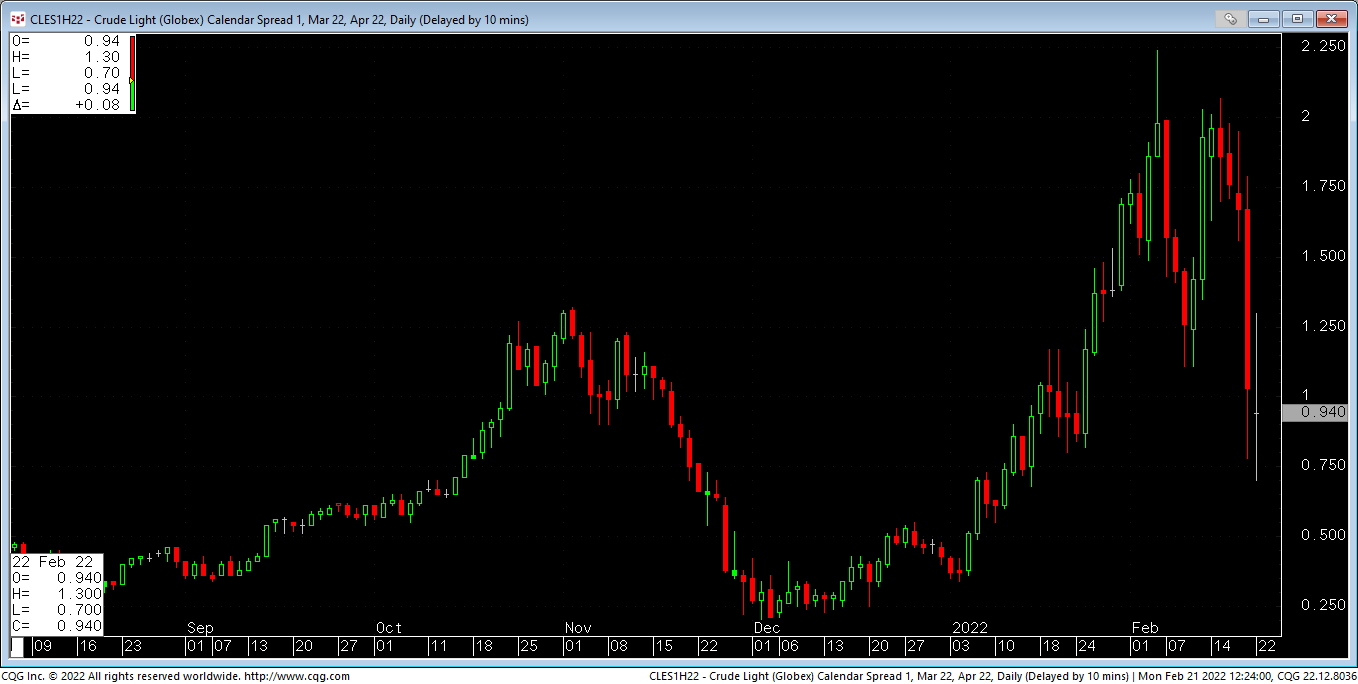
Below is a soybean basis chart of US Gulf cash minus front-month CME Group soybean futures price (see Figure 2). As you can see, for this location, the cash price almost always trades at a premium to futures because the US Gulf is far from the supply region (US grain belt) and closer to overseas export demand centers such as China.
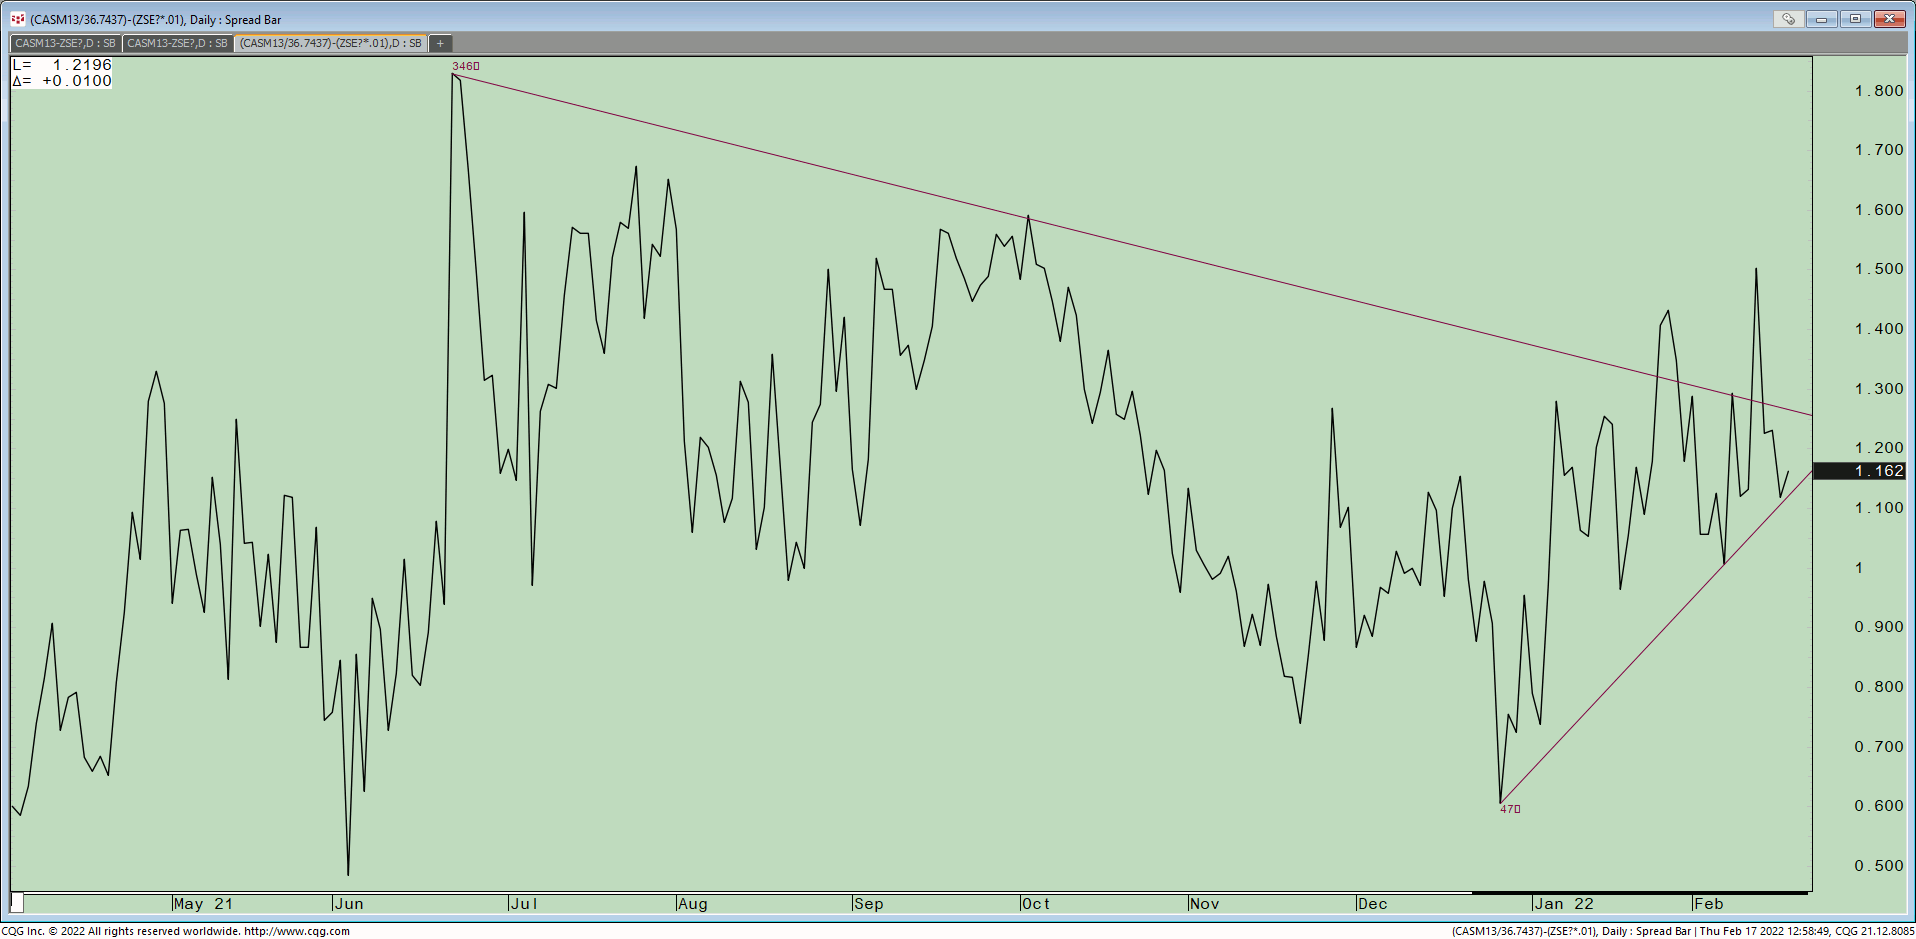
Now that I’ve shown an example of locational basis risk, let’s simplify things by examining calendar basis charts. Specifically, we’ll look at the basis between “spot” (or front month) futures and deferred futures contracts (See Figure 3 below). The first thing we notice is that here again spot month futures (March, 2022) are trading at a premium to deferred month (April, 2022). This phenomenon is a market in backwardation or an inverted market and when it occurs in a commodity like crude oil, it is often telling us something about the market’s view of the future trend of this asset, namely that it is bullish. Why? Because (in general), backwardation shows that the commodity is experiencing a supply/demand imbalance and that consumers are willing to “pay up” for cash and spot month futures regardless of storage costs due to the fact that:
- They need the commodity right now regardless of physical carry costs
- They fear that they’ll have to pay even more in the future (e.g., 3-18 months from now) so they’re willing to pay up and store it now.
Of course, a calendar basis chart could be positive (e.g., in backwardation) and the market trend might still be bearish. This is especially common in seasonal commodities such as Henry Hub Natural Gas when we roll from winter (March futures) to spring (April futures) gas. Although seasonality makes understanding basis charts more challenging, we feel that an analysis of basis charts can give commercial hedgers an edge in determining how aggressively they should hedge in today’s commodity markets. If you’d like to see how we use basis charts and other technical tools to develop a rule-based, active hedge program visit our website: https://weissmanconsulting.com/the-technical-hedger