I have always believed that every active hedge strategy needs to answer the following three-part question:
- Percentage hedged
- Duration of the hedge
- Derivative instrument(s) used to hedge
Percentage hedged “seems” fairly straightforward. What percentage of our physical market exposures are we going to hedge with derivatives? The obvious answer is a lower percentage at historically “suboptimal” prices and a higher percentage at “optimal” prices.
For example, a refiner looking to hedge their production of Ultra Low Sulfur Diesel might look at a monthly continuation chart of settlement prices on March 8th 2022 of $4.4373 and conclude (based on historical pricing) that this was an excellent opportunity to hedge aggressively (See Figure 1 below). Based on our three-part question this hedger might decide to hedge:
- Percentage hedged: 95%
- Duration of the hedge: 18-month strip
- Instrument(s) used to hedge: Short Futures
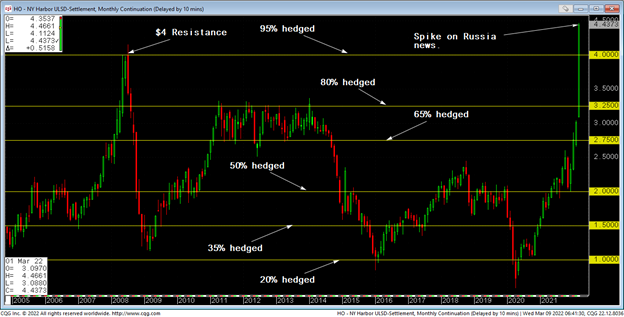
Figure 1: Nymex NY Harbor ULSD Monthly Continuation Chart
Although it might “seem” based on our analysis of the chart that our rule is saying to hedge 95% of our physical production, remember that our hedge decision was based on prices being above $4/gallon throughout the entire 18-month strip. Looking at Figure 2 (see below), what we immediately notice is that only April and May settled above $4/gallon and so our hedge based on might actually play out as follows:
Percentage hedged: 95% - April, May
Percentage hedged: 90% - June - $3.86
Percentage hedged: 85% - July - $3.61; August - $3.45; September - $3.36
Percentage hedged: 80% -October - $3.26; November - $3.165
Percentage hedged: 75% - December - $3.08
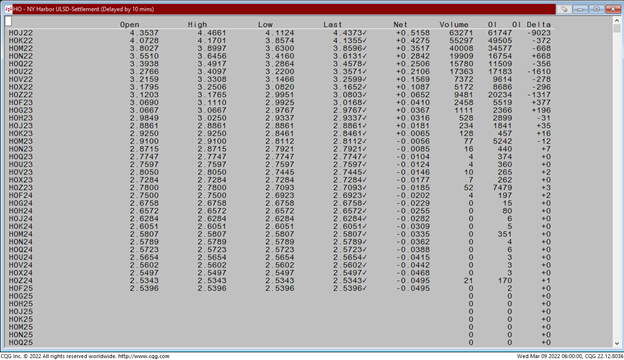
Figure 2: Nymex ULSD Settlement Prices for 3/8/22
In fact, based on the pricing on the forward curve, we might only hedge out to December, 2022 futures since locking in prices below $3/gal beyond nine months into the future “might” end up being suboptimal for a refiner. In other words, by waiting to hedge 2023 production, we could hedge at higher prices and if prices don’t rally above $3/gal, the duration aspect of our active hedge strategy might kick in, as shown in the table below (see Figure 3). If you’d like to see how we use the forward price in real-time to develop a rule-based, active hedge program visit our website: https://weissmanconsulting.com/the-technical-hedger
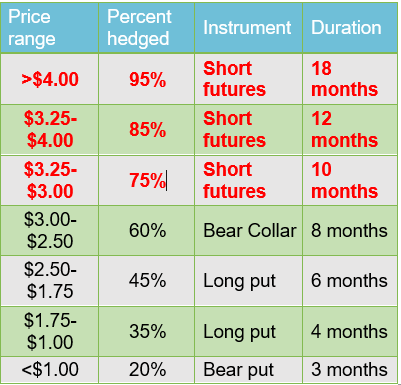
Figure 3: Active Hedge Strategy for a Producer of ULSD