Divergence can be likened to being able to see an eel in clear water. It's highly visible but try picking it up and holding on. If divergence is to be used as part of your armory it must be linked to patterns that are sufficiently rare to be meaningful, and be linked to a firm structure, whilst understanding the limitations of using Linear calculations such as the RSI and Slow Stochastic on Non-Linear data.
The reality is that nearly all trends diverge whatever the timeframe, so accepting the mantra that these indicators can signal overbought or oversold is highly dangerous. The study has a limit of scale and becomes oversensitive at high or low levels, but price can go anywhere.
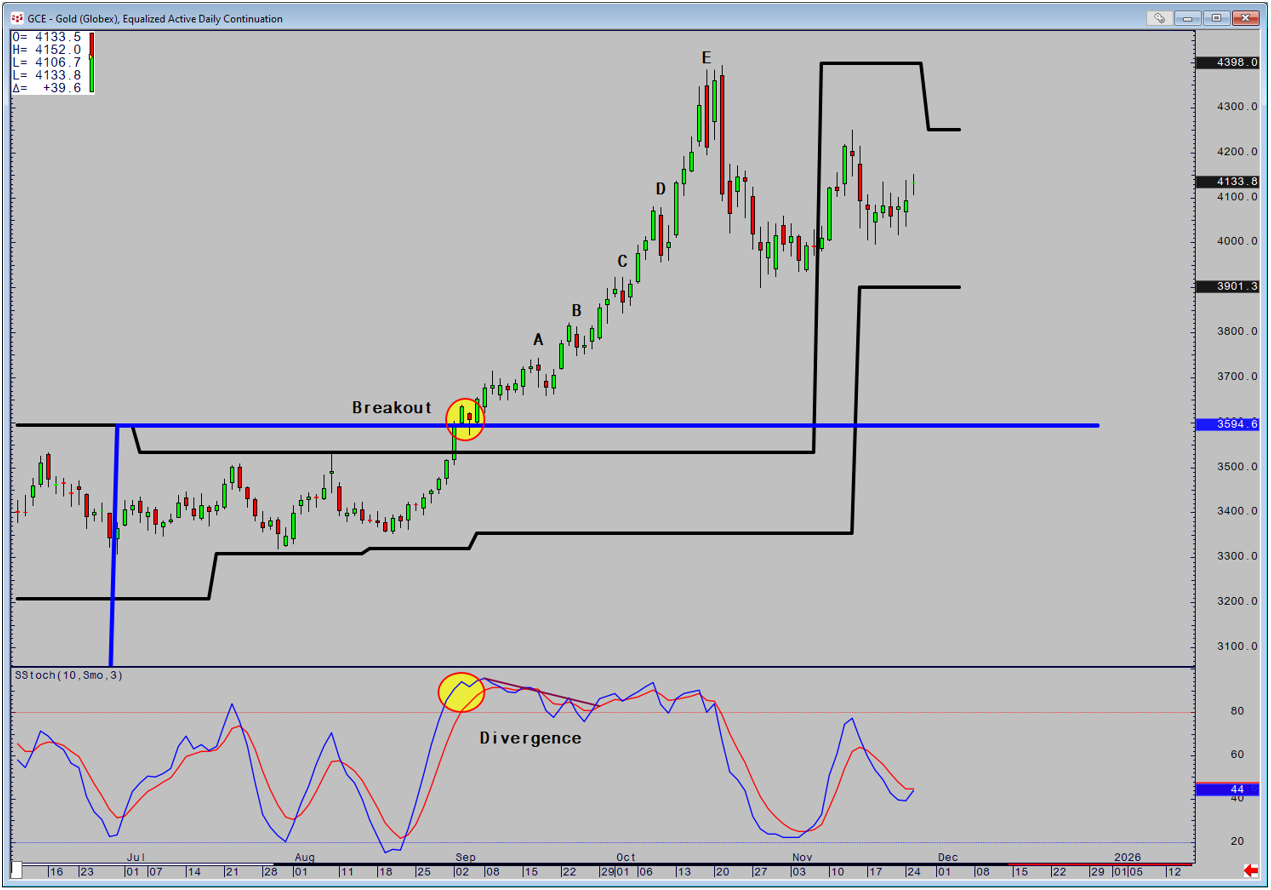
The recent Gold rally is a classic example. When price closed above Final Monthly based Resistance via the Peak Expansion Line (circled), the Stochastic was already in the 90's and to many overbought. Extensive testing has taught me that when the Stochastic becomes overbought or oversold it is actually potentially the beginning of the trend, especially when price has broken a key level as was the case here. It is not whether it is overbought or oversold per se, it is how long it stays that way. For reference it is overextended once it has stayed that way for 30 Periods or One-Half Cycle Length as referred to in my first book.
Returning the chart, at points A and B the Stochastic crosses down and creates divergence in the classic sense. Both fail, and as the trend accelerates, just one Day is sufficient to make the study cross down, highlighting how oversensitive it becomes at points C and D. Finally the day before the top at Point E a divergence does appear, but risk is considerable and price did make a new high the following day. When we collapse, risk in being short has spiraled to near $300 from the high.
Incorrect applications of the concepts or overbought and oversold and subsequent divergence will do two things: Constantly tell you not to be involved in a great trend, or even worse, tell you to trade against the trend. The monetary and psychological damage can be considerable, and often when the turning point does eventually come, chances are you won't be involved.
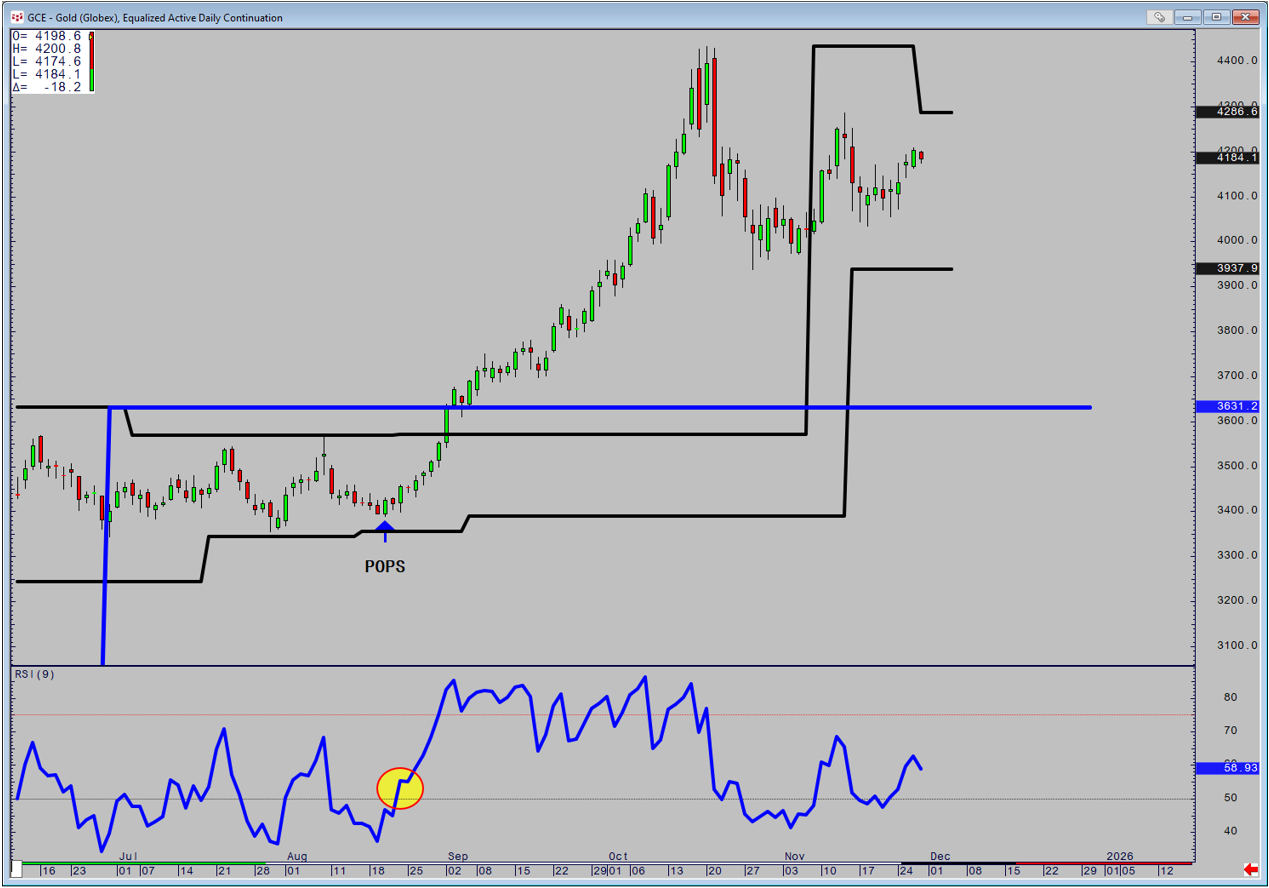
I have spent many years quantifying divergence in a variety of ways in terms of frequency of signal, the different relationships between price points and momentum, and the sensitivity of the indicators themselves. The first pattern I ever created over 40 Years ago is still in my armory and is very simple. Price makes a nine-bar high, or low and the RSI makes a three-bar high or low. There is no value put on the RSI itself for two reasons. I realized that linking the pattern to overbought or oversold in the traditional sense, overcomplicated what was a valid signal, especially given the RSI's limit of scale. More importantly, when linking the pattern to what the trend was doing opened up new avenues. Namely, the possibility of getting signals within a sideways pattern, and most usefully getting divergence as a continuation e.g. the trend is up, and a move lower is rejected, and the RSI makes a 3-bar high.
The chart below shows the Pattern which for a positive I call POPS. The trend is definitely sideways, and the pattern is above a major weekly based support (black line). This would mean with support adjacent that all shorts would be covered and therefore the signal is purely an exit. The Question is whether it can become a long entry.
In order to do this I move from the Equalized Daily Continuation to the equalized 60-minute. This will enable me to see the short-term picture and whether I can define risk for a long position. This also has the Peak Range and Energy studies applied to the 120,240,360 and 720-minute swing points (multiple timeframe analysis). The yellow rectangle is the day of the POPS signal. The chart shows that I have final short-term support on the next two circles. This enables me to place a limit order at that level, and I can define risk two-ways. Firstly, if price closes below it intraday on a 60-minute basis, or if we make a Daily Close below it. If it does that, there is no short-term support, and the weekly based level is still relatively far away on a risk basis.
The sharp rally directly to the top of resistance is caused by Feds Powell's comments. Therefore the risk averse could have waited to see what he was going to say. The more adventurous can use that resistance to take some partial profits if they so wish. Powell was deemed to be dovish, and the Dollar fell sharply, meaning that the Gold move was largely currency related. In Golds case I also look at the price in World Currency Terms to gauge how much the currency is influencing. In this case it was also up.
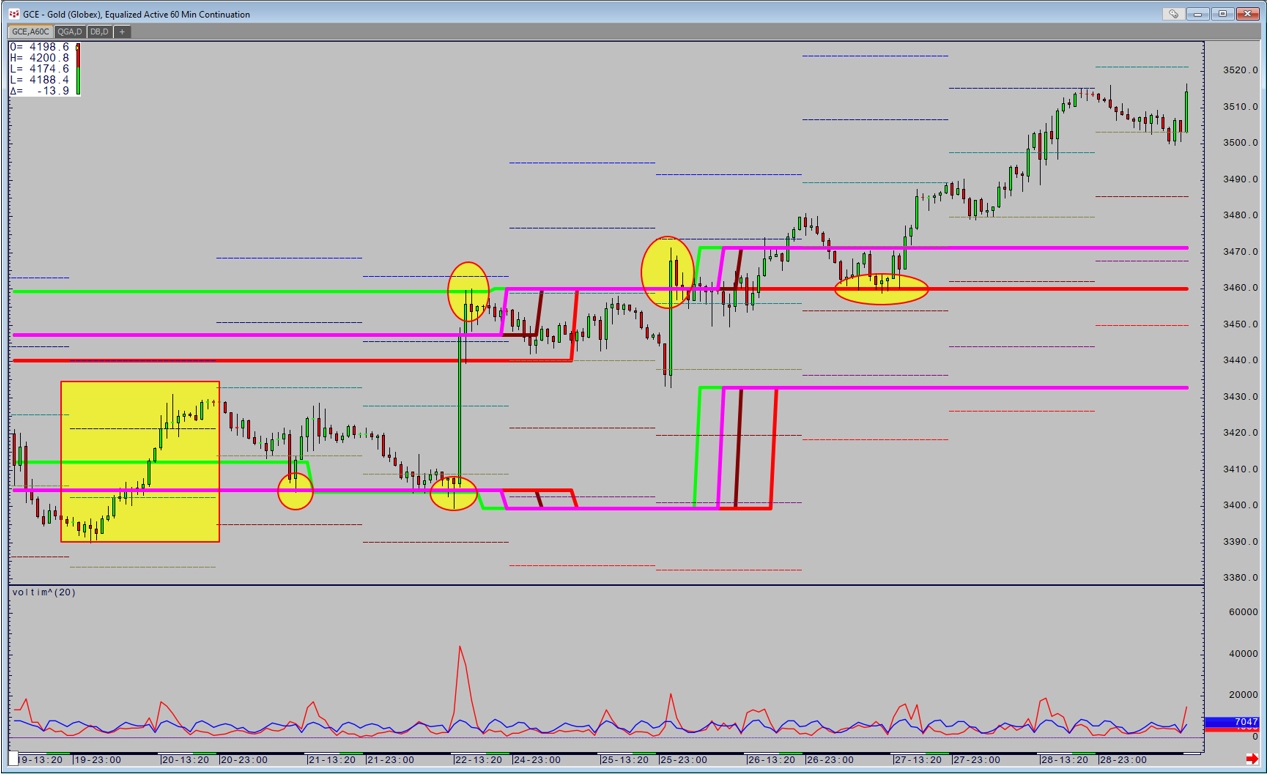
Price is quiet for two days, before a sudden move on China's opening signals a breakout. Obviously, I would have missed it, but I gauge the meaning of the move by using the Volume Time study below. It states that for the time of day compared to the 20-day average for the time of day, volume is over 3 times higher than normal, which is significant. The following day I am given an opportunity, because the ideal support point is move back down to the breakout point (second circle). It holds and the rally begins in earnest. The volume in the second half of the move into the support point is also double what it is normally, indicating heightened interest and acceptance of buying at a higher price. Next month we will look at how that rally was managed via other divergence patterns and the use of Range Relativity to identify profit taking points when most analysis has little to hold onto when price goes somewhere it has never been before or for a long time.
Read Quantifying Divergence Part 2
This is a CQG PAC to install the Time Study used in the article.
