The big picture is that markets trend. Not all the time and those trends don't last forever. That stated, catching the trend should still be the goal of the successful speculator and should determine the aggressiveness or lack of aggressiveness of the activities of the commercial hedger.
How do we determine the "trend" of the market? Although there's no universally accepted definition of "the trend" nor how to follow it, one of the most commonly accepted ways to determine the trend of the market is the moving average crossover and the most common parameters for this trend-following indicator are the 50-day moving average and the 200-day moving average. In fact, these parameters are so common that they have names associated with their crossings: when the 50 crosses above the 200 it is called the golden cross and when the 50 crosses below the 200 it is called the death cross. In addition, there are different ways to "weigh" these moving averages and I leave it to the discretion of the reader as to how they choose to weigh the moving averages (e.g. simple, smoothed, exponential, and so on).
Some long-term trend following traders will stop there and simply buy bullish crossovers and sell bearish crossovers. We call these types of trading models "stop and reverse" because they do not allow for neutrality (see figure 1.1)
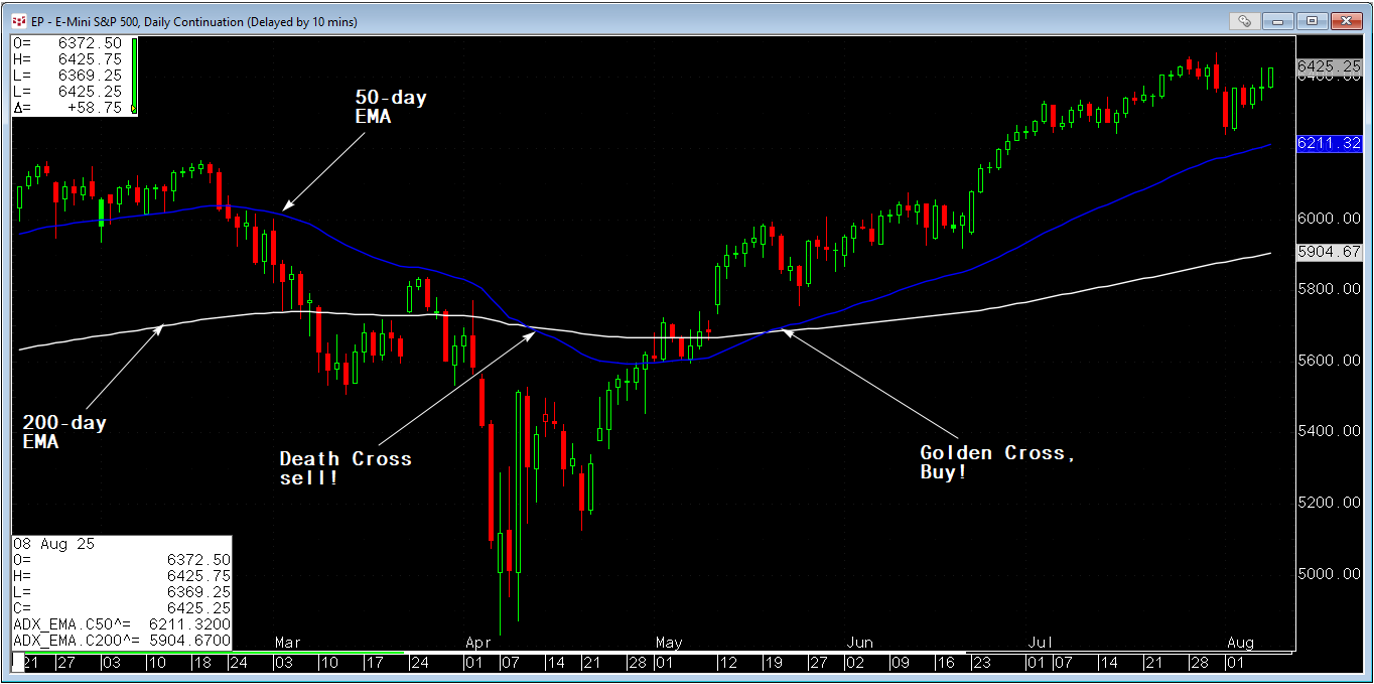
Figure 1.1 - E-Mini SP 500 Futures Contract - Daily Continuation Contract
The fact that this trend-following method doesn't allow for neutrality is usually viewed as a drawback and therefore many trend-following traders will combine this tool for determining the long-term trend of the market with a second tool intended to filter out sideways periods known as Channel Breakout (or Donchian Channels). The theory of Channel Breakout is that we want to participate in trends that are not only moving up in a "lagging" manner as determined by the moving average crossovers, but are also moving up in the short-term by breaking the highest high over the past twenty trading days (in a bull market as defined by the golden cross) or breaking the lowest low over the past twenty trading days (in a bear market as defined by the death cross). As we see in Figure 1.2 (see below), channel breakout filtered out the bearish crossover's false sell signal and then confirmed the bullish crossover's buy signal.
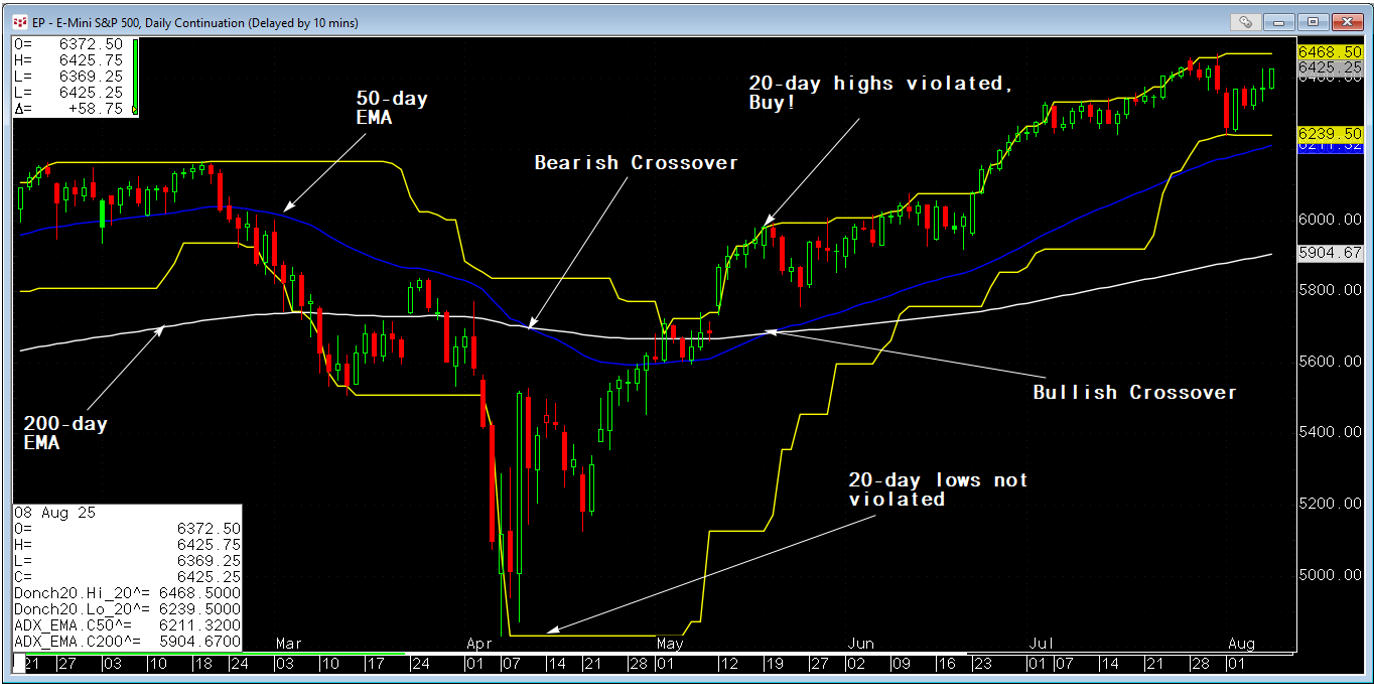
Figure 1.2 - E-Mini SP 500 Futures Contract with Moving Average Crossover and Channel Breakout
This is actually where many long-term trend following systems turn off their computers and call it quits. When I first started trading this method something stuck out to me like a sore thumb: what about all those times when the market is bullish as defined by the golden cross but breaks the 20-day channel breakout low? Obviously one of those times will represent a new bear market, but aren't all the other times buying opportunities? See Figure 1.3 below:
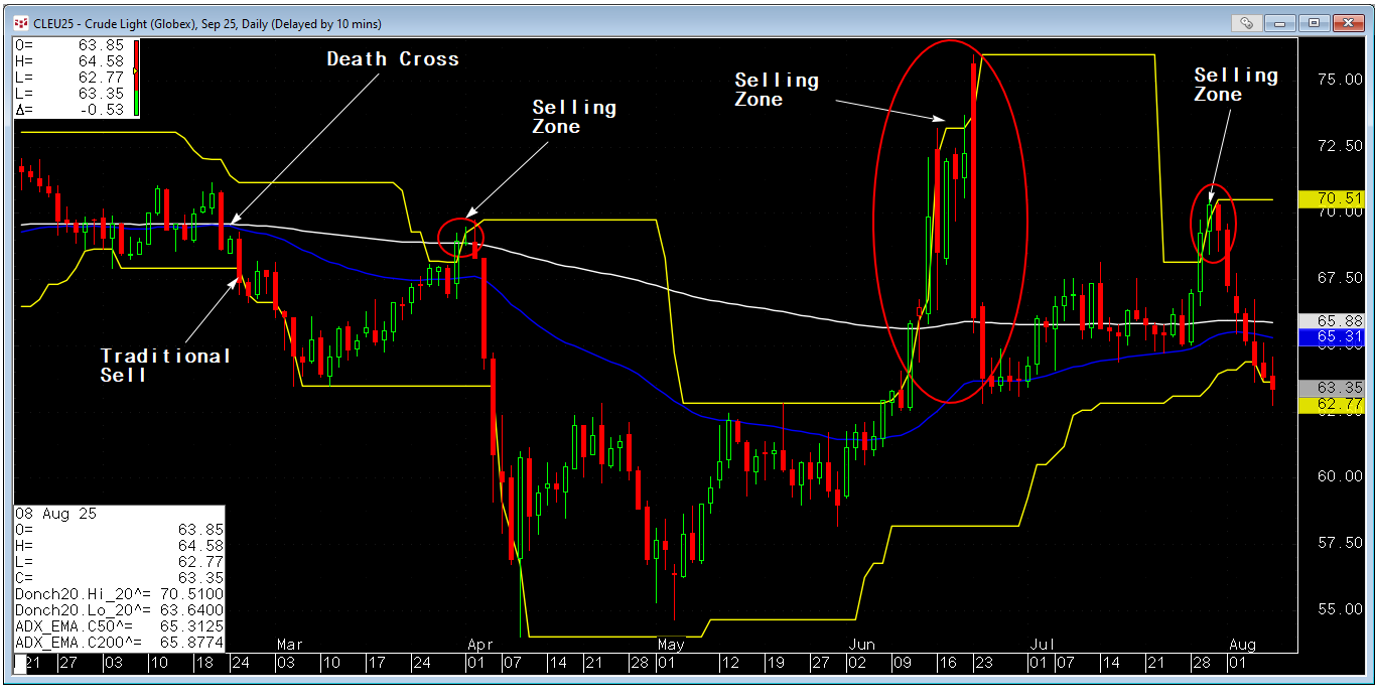
Figure 1.3 - September 2025 CME Group WTI Crude Oil showing selling opportunities following a bearish moving average crossover
Selling into the sell zones in Figure 1.3 is commonly known as "trading around a core position". In Figure 1.3 our "core position" is short at $67.39 after the market breaks the Channel Breakout low and the moving averages have a bearish crossover. As of August 8th 2025, that core bearish position is still on and our mark-to-market is an impressive $63.35 or $4,040.00 per contract in unrealized gains. However, look at the highs on June 23rd of $75.98. Not only does that represent a negative mark-to-market of around $7,630.00 per contract, but more importantly since we are still in a bear market (according to the death cross), this is an area where we could add to our core short position. The same could be said for the April selling zone and late July selling zone.
In fact, looking at our Crude Oil chart in a vacuum we might be tempted to forget about our core selling position and simply play the swings from sell zone to covering zone over and over again. One look at March 2024 Cocoa changes that notion. The very best portion of a trend will sometimes never pullback and in those instances holding on to your core position is essential or you'll miss the trend (see Figure 1.4 and 1.5)
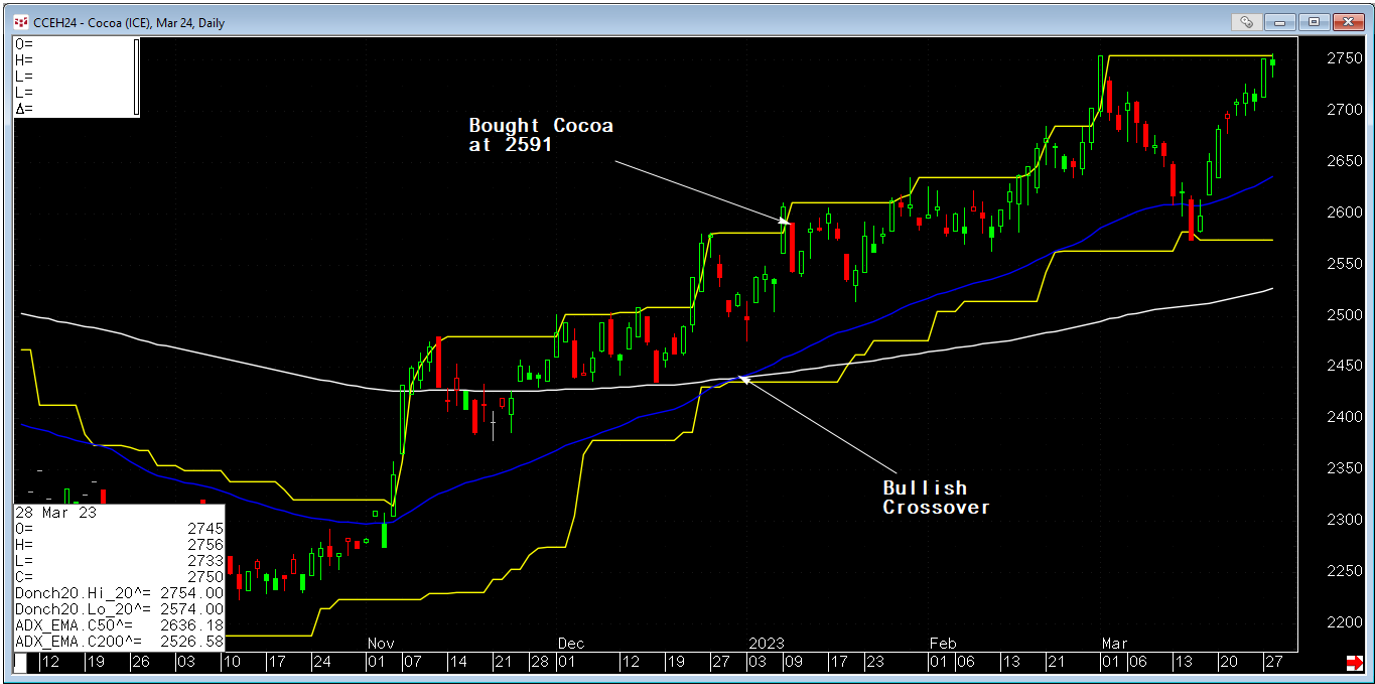
Figure 1.4: March 2024 ICE Cocoa
Figure 1.5: July, 2024 ICE Cocoa - Shows why we must hold the core trend-following position instead of waiting for a pullback
This is one of my main strategies; I hold a core long-term trend following position and trade around that position based on pullbacks against the long-term trend.