Back when I began my trading career in 1979, Technical Analysis consisted of receiving a Knight Ridder chart book and the updating it by hand through the week. With a calculator I could calculate the new Moving Average Values. The only other indicator was the Volume and Open Interest which led to my reading of one of the few books I have ever read on Technical Analysis many years later. It was Ken Shaleens Volume and Open Interest.
A few years later, sitting neglected and dusty, was a green screened Contrend terminal which whilst basic, did give you the Welles Wilder Studies and a few others. I have always made the point of testing and analysing indicators without having read anything about them. That way I can come to my own conclusions without being subconsciously influenced. Once done, I would sometimes look at what the originator said and more often that not my conclusions were very different.
The Mid Eighties saw a sudden quantum leap. Up to that point the Pit Traders simply had the daily Pivot values as a reference, and they worked very well as it was all anyone had. The new kid on the block was Pete Steidlmeyers Market Profile. Once again, I was drawing on Graph paper and trying make sense of it. The process of drawing your own graphs is illuminating as the process engages you more and provides insights beyond visualisation. Not soon into the process I spotted that If I merged the last 5 days into one picture, it was very different and provided new techniques and theories. Why 5 Days? Because short term traders can't remember more than 5 days back.
This worked well until the advent of Globex and 24-hour trading. This obscured the picture, but thankfully by then CQG became the first software company to show Profile via an Exclusive agreement with Steidlmeyer. They also allowed you to just show the original pit hours although merging still had to be done by hand. To this day I still use the 5 Day Pit only Profile. An added benefit is that you are still aware of a long-lost method of analysis. Gaps. Traders are simply too lazy to redefine data and therefore see where they are.
The chart below shows the short-term profile. Note the Gap but more importantly the Point of Most Time or Control at 4582.50. The low overnight on a spike down on Taco (Trump always chickens out) is 4580.40, so has held perfectly. Pomt points are one of the most powerful levels as they represent where ultimate Fair Value lies.
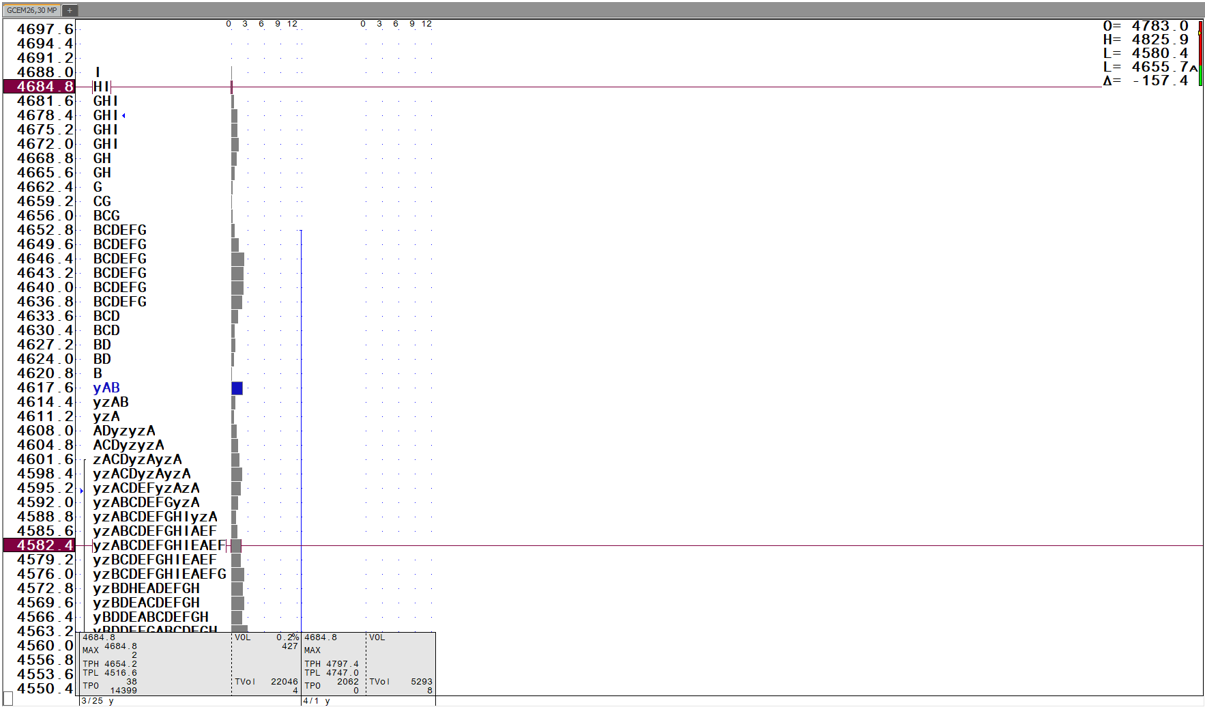
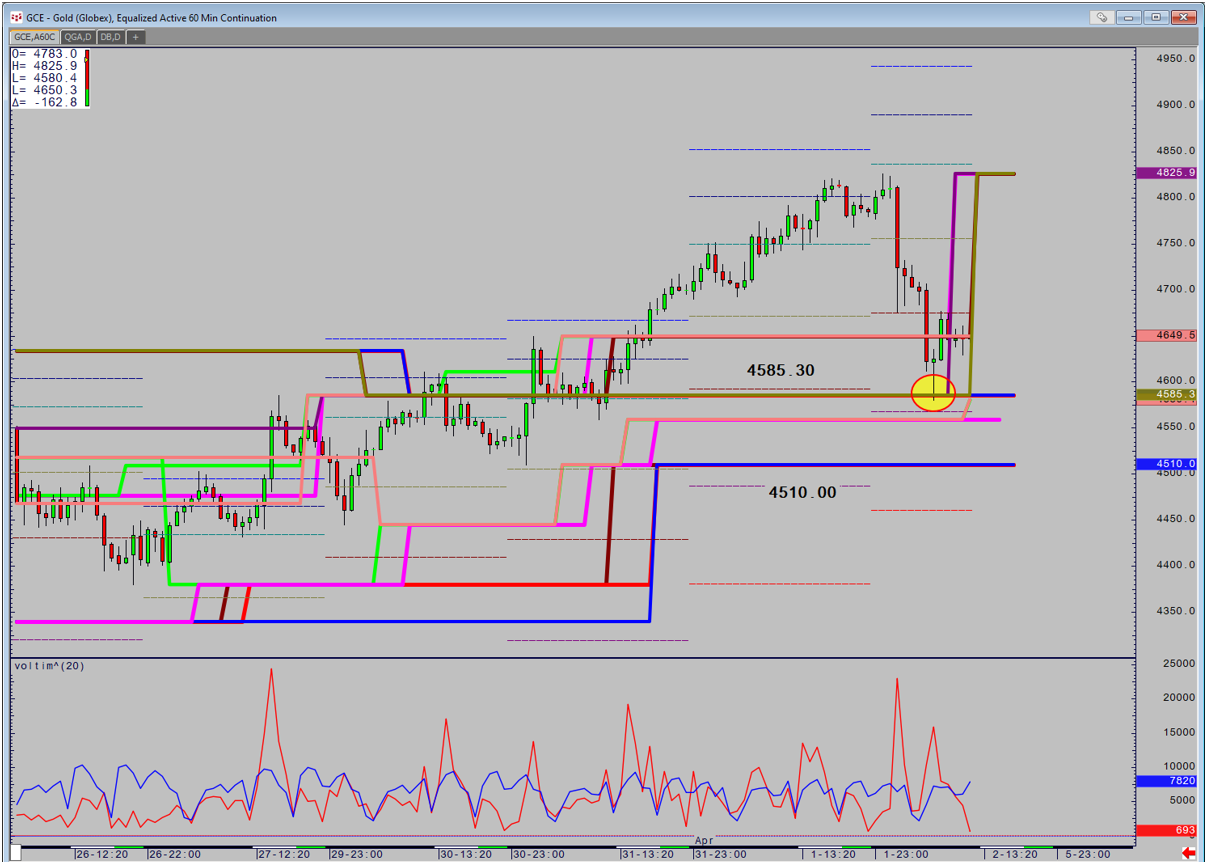
It also coincided with the Peak Range and Volume 360- and 720-min lines showing a major support a couple of bucks higher at 4585.30, thus creating a powerful zone.
Beyond merging 5 days the next critical development was to create rules about how new distributions could be built. The reality was that unless I received one of my patterns that could indicate a reversal of trend, that then confirmed itself in the subsequent days, I was simply left with the supports and resistances that when breached would switch the technical picture. At that point a New Profile could be built.
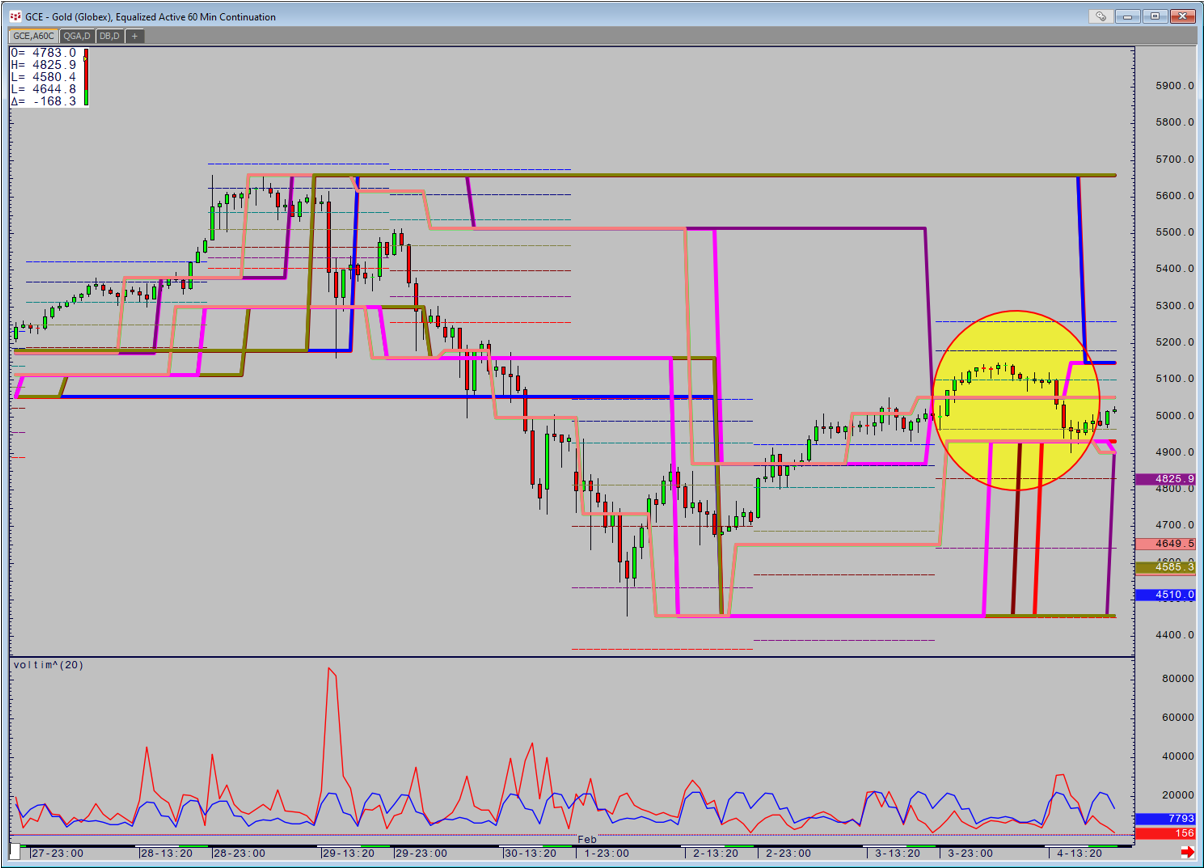
Returning to Gold, there was a major low on February 2nd, that was confirmed two days later when price broke through short-term resistance and supports moved up as circled. This switched the trend from Down to Sideways with a Positive bias and so allowed for a new Profile to be built from that low.
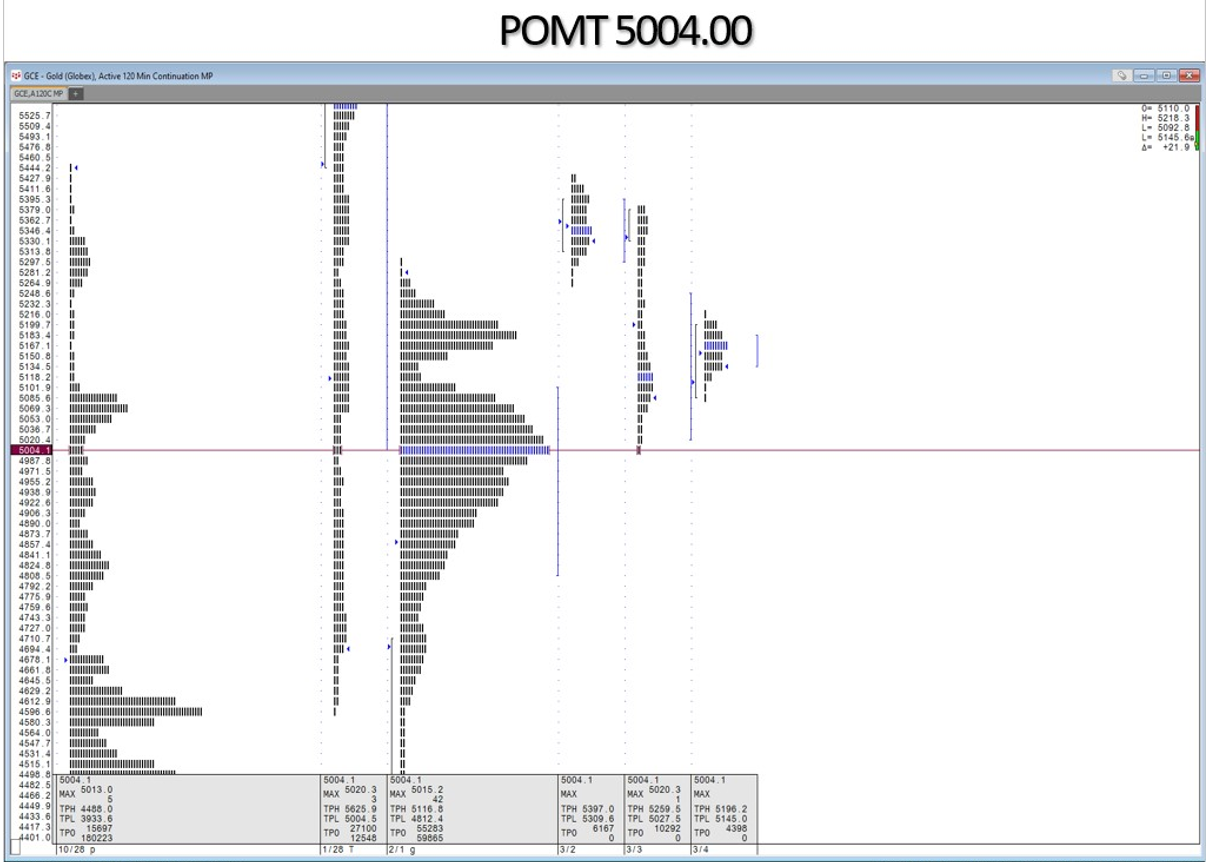
Time moves on and a Major Point of Most Time appears at 5004.00 on my technical commentary as a major support. 1 month after the original low, price spikes down posting a low of 5005.00. The lesson here is always place limit orders a little ahead of the level.
Next month we will look at how different distributions are created as trends change and begin the process of understanding the connection between Patterns, Divergence, Profile and Peak Range and Volume on intraday and historical charts so that the technical picture can be completed. Remember, The Chart Tells You, You Don't Tell the Chart.
