The KDJ Indicator

The SSK indicator using a divergence line

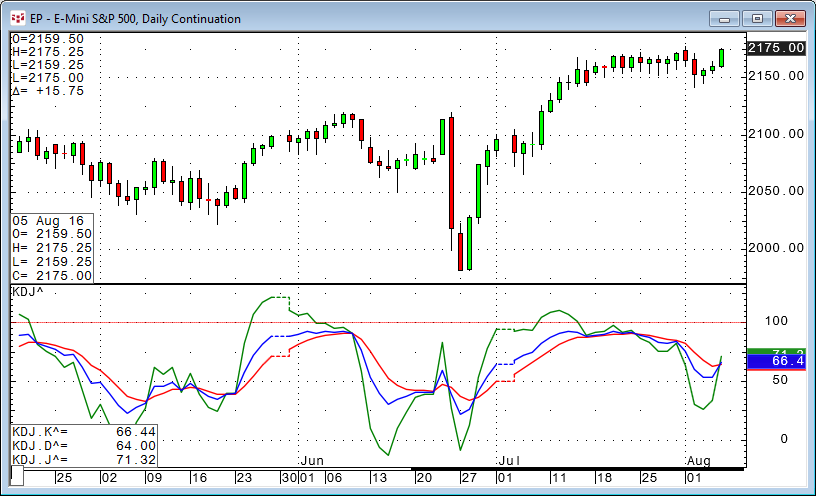
The KDJ indicator is actually a derived form of the Slow Stochastic with the only difference being an extra line called the J line. The J line represents the divergence of the %D value from the %K. The value of J can go beyond [0, 100] for %K and %D lines on the chart.

Divergence calculation = 3* SSK – 2* SSD

The red and blue lines are standard Slow Stochastic while the green line is the J line.

Download the PAC file ‌‍‍‍‍

File
KDJ.pac1.4 MB

Disclaimer

Trading and investment carry a high level of risk, and CQG, Inc. does not make any recommendations for buying or selling any financial instruments. We offer educational information on ways to use our sophisticated CQG trading tools, but it is up to our customers and other readers to make their own trading and investment decisions or to consult with a registered investment advisor. The opinions expressed here are solely those of the author and do not reflect the opinions of CQG, Inc. or its affiliates.