The Trader Dynamic Index is a combination of RSI and Bollinger Bands. We use a 13 period RSI with a tight moving average on top of it and another moving average on top of this. This is some kind of double smoothing. Also as a 34 period Bollinger Band on the RSI.
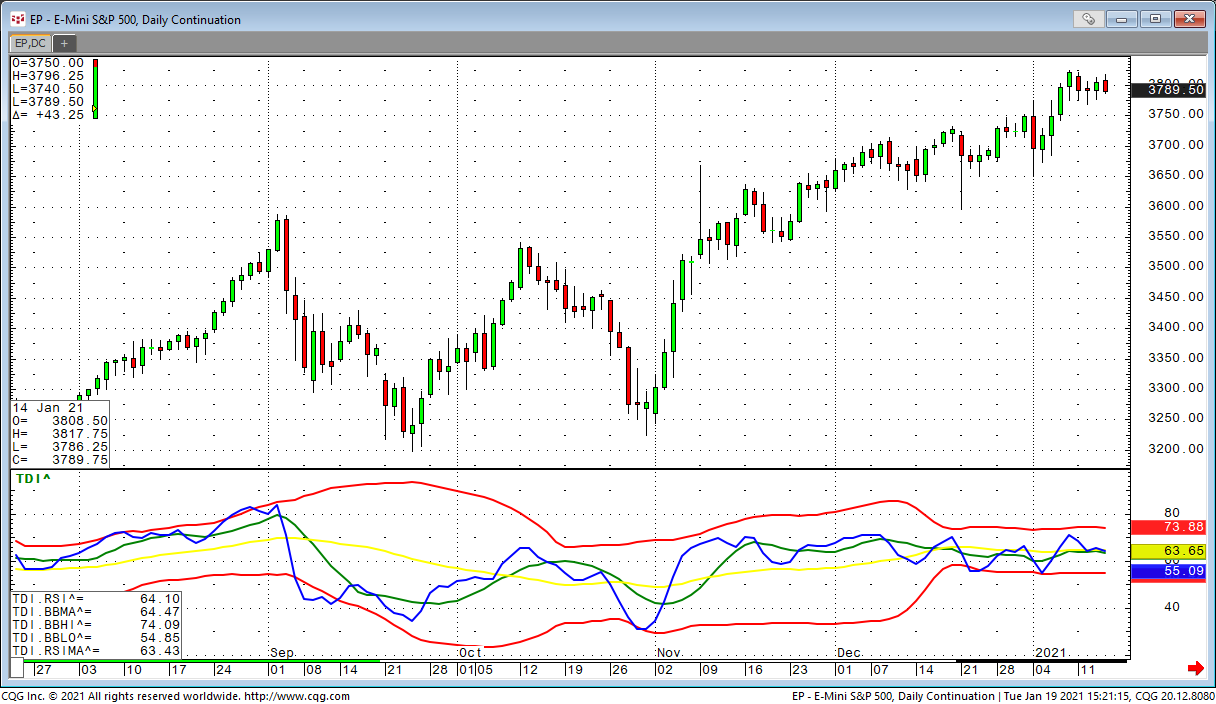
Of course, the parameters and colors can be changed!
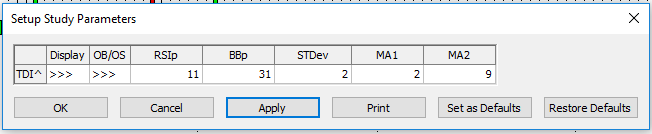
RSIp = period of the RSI
BBp = period of the Bollinger Bands
MA1 = period of the moving average on the RSI used for all calculations 1 = original RSI*
MA2 = period of the moving average on the RSI used as a trigger line
STDev = Standard Deviation for the Bollinger Bands
*= I found different interpretations of this study on the internet so I decided to go for the more flexible one. At first glance, it looked like RSI with BB’s and MA’s on top. On some articles the first RSI was already smoothed by an MA of two and the whole calculation goes on top of the already smoothed RSI. The simple method can be used by setting the MA1 to “1”.