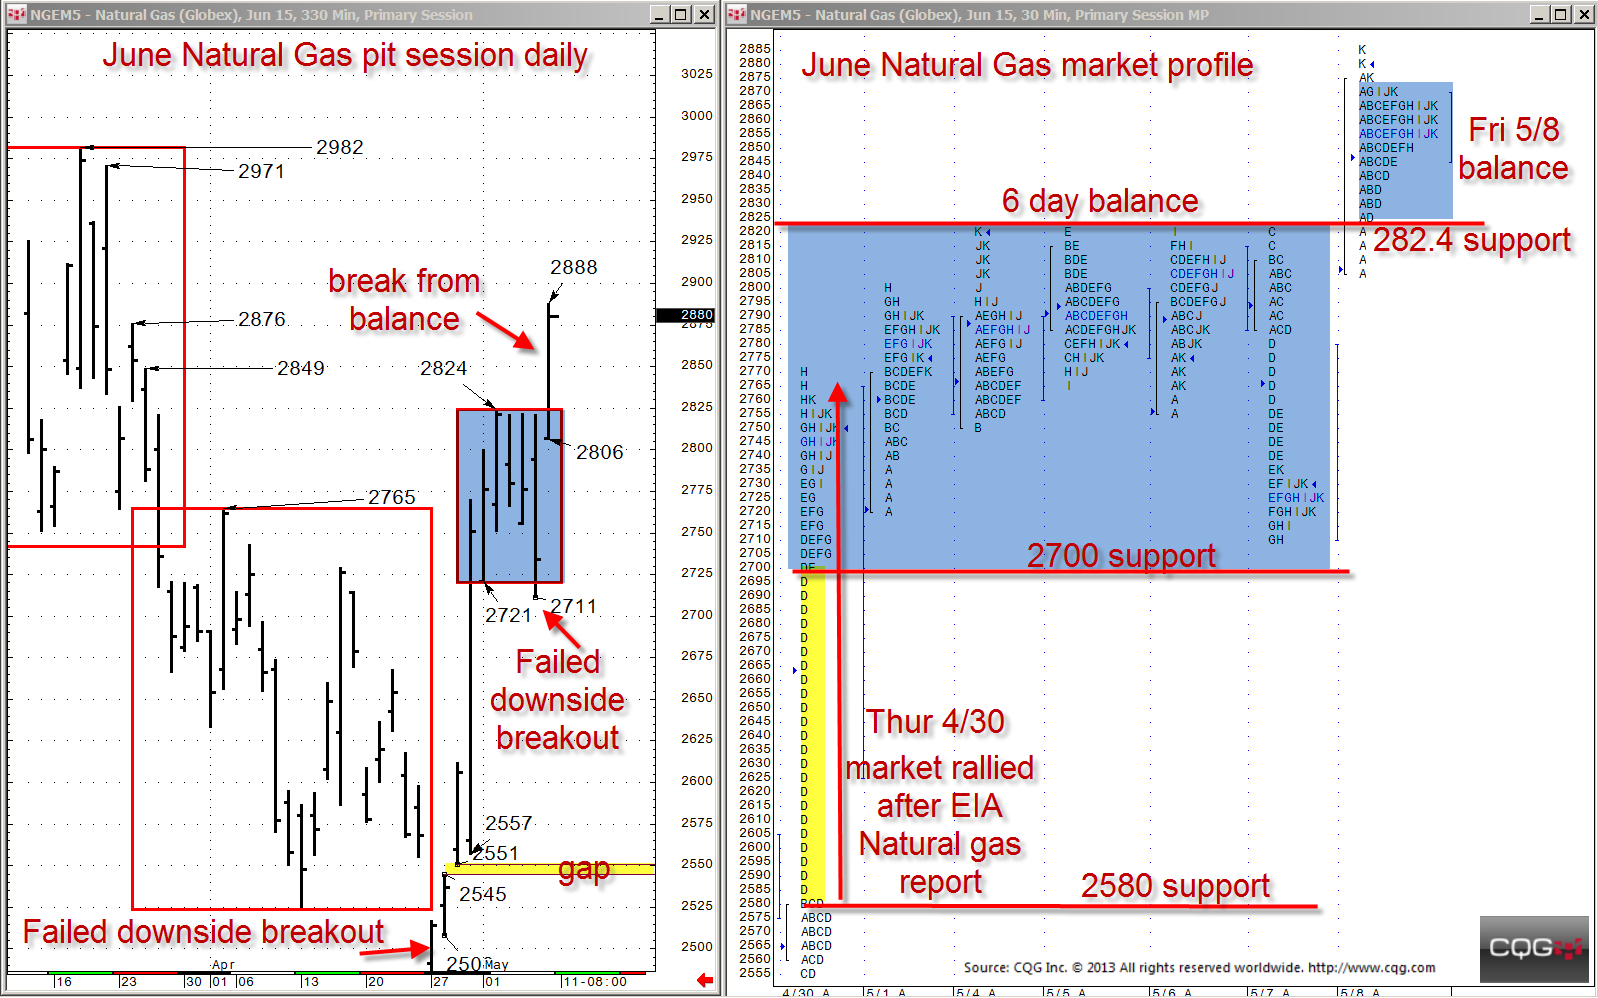
From the middle of March until the end of April, June natural gas held a steady decline from about 290.0 down to below 250.0. However, over the last ten days, much of that decline has been retraced. Most of the retracement occurred on Thursday, April 30, after the EIA Natural Gas report sparked a 200-point rally. From May 1 to May 7, natural gas found a 270.0 to 282.5 range where the market rotated. However on Friday, May 8, the market broke above that six-day balance range and finished on the high. The market may or may not make the 100% retracement up to the 298.2 reference where the original decline started, but it has left some important references below to keep track of.
Upside Continuation
If the market gains acceptance above Friday's balance range, the next upside target is the 297.1 reference.
Downside References
Friday broke above the six-day balance high of 282.4 and found that same price to be support for the day after the original move up. If the market gains acceptance below the 282.4 support, the 270.0 six-day-balance low becomes the target.
Additionally, if the market gains acceptance below the 270.0 support, it may quickly test the 258.0 support reference. On Thursday, April 30, after the EIA report, the market rallied over 100 points within minutes, and 270.0 became support for the remainder of that day and the days that followed. Many times when a market travels through a range at such a fast speed, it travels at a similarly fast speed in the opposite direction when it finally gets back to that range.
