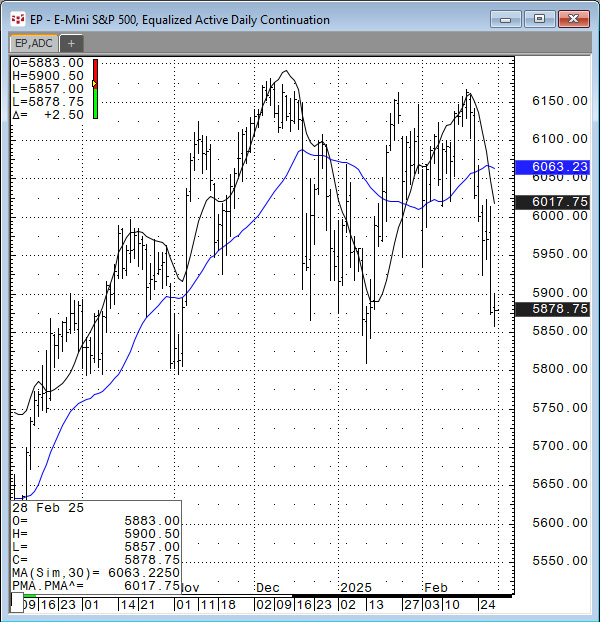
VWAP is the volume weighted average price for a futures contract plotted as a line on the price chart. The calculation is the sum of traded volume times the price divided by the sum of the traded… more
CQG PAC Files
In the March 2025 issue of Technical Analysis of STOCKS & COMMODITIES magazine John Ehlers, President of MESA Software, presented "A New Solution, Removing Moving Average Lag."
The… more

The PriceToDollar function converts the prices of the particular market to their value. For example, below the E-mini S&P 500 futures contract's last price is 6003.75. And 6003.75 multiplied… more

Two recent posts CQG Primer: The Level Function and Level Function Using Excel RTD Formulas detailed using the Level function available in CQG IC and QTrader. The Level function plots two lines,… more

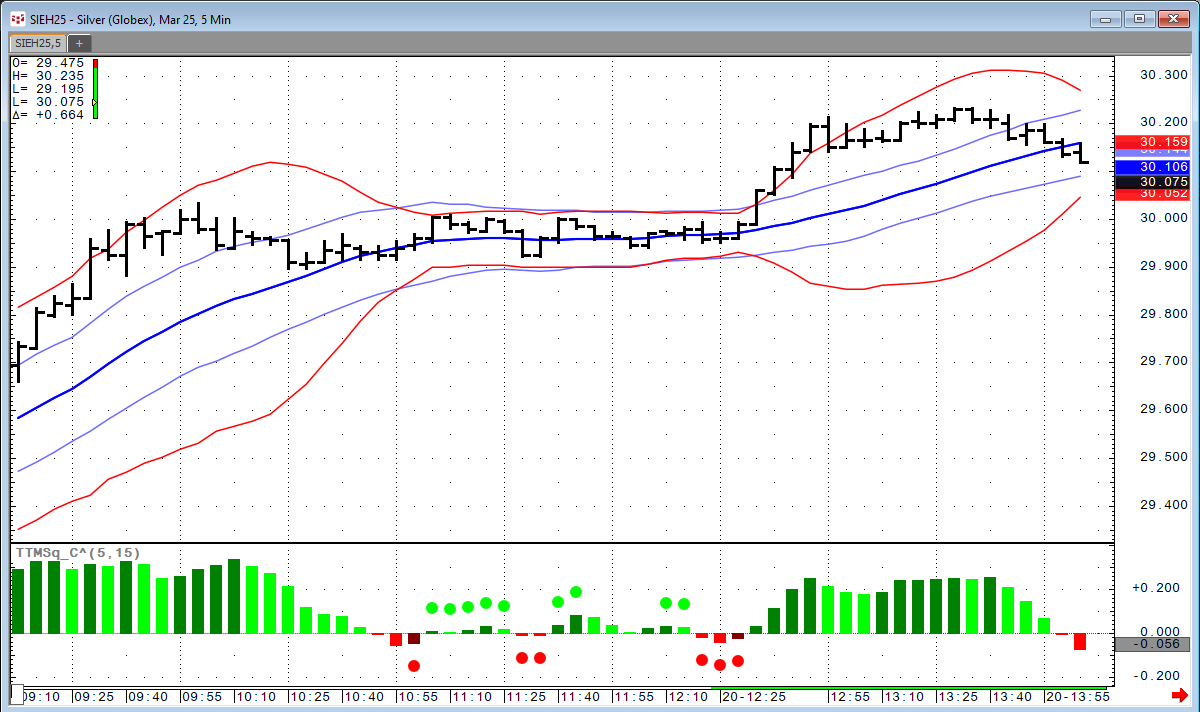
This post covers two topics: Details using the Chart Analog Overlay Study and the Percent Bar chart type.
Traders use the analog study to compare how markets are trading relative to each… more
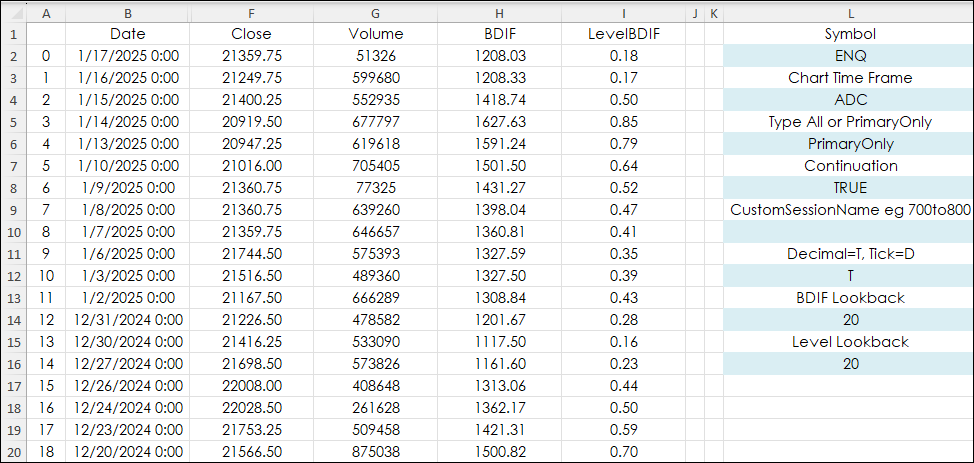
This post "CQG Primer: The Level Function" introduced the Level Function. The Level Function plots two lines, which identify the highest and lowest levels attained over a defined period. The… more
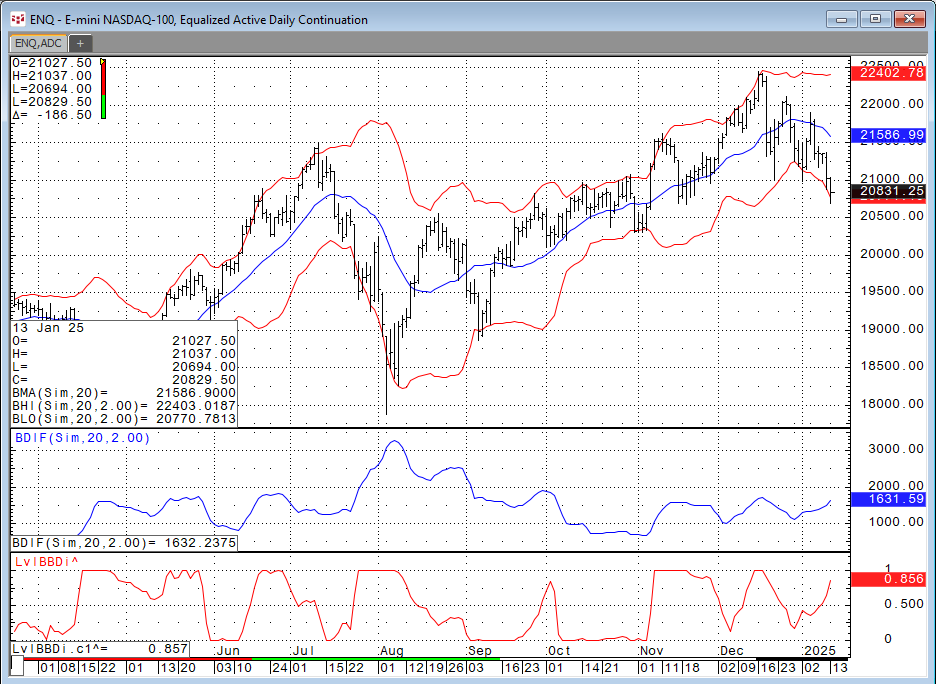
The Level Function plots two lines, which identify the highest and lowest levels attained over a defined period. The chart below displays the Level Function using the default lookback period of 20… more
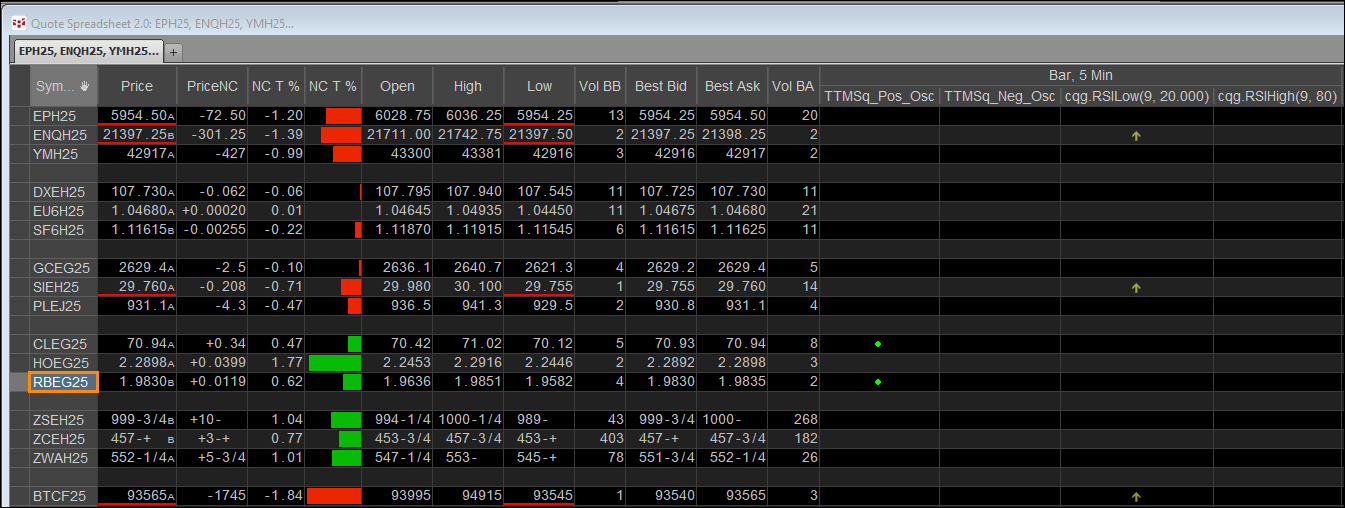
This post details using CQG's Quote Spreadsheet 2.0, Instrument Monitor, chart and DOMTrader to monitor and trade a portfolio of instruments on a single page.
The benefit of the Quote… more
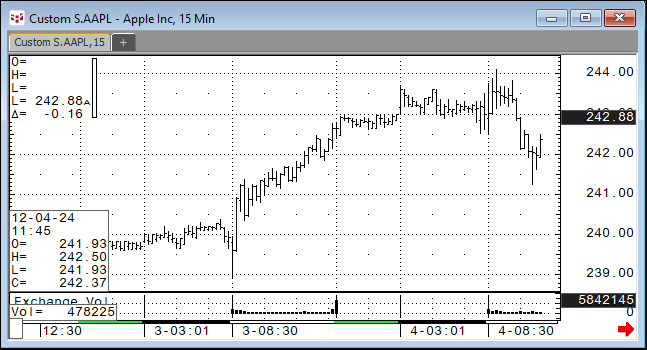
Markets move through phases: An uptrend (higher highs preceded by higher lows), a downtrend (lower lows preceded by lower highs) and sideways or consolidation price action.
Technical based… more
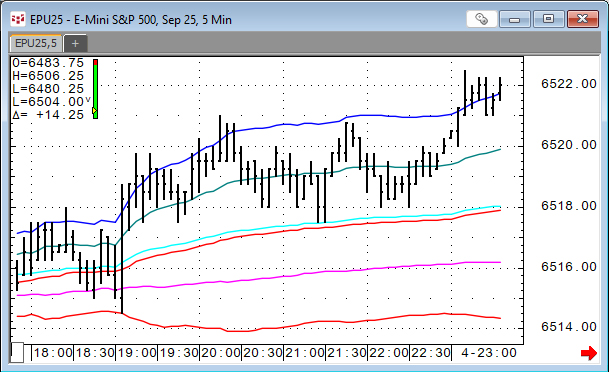
CQG IC and QTrader users can chart bid and ask orders activity for stocks during pre-market trading hours and after-market trading hours. This requires a custom session and setting the chart data… more