Going all the way back until the famous turtle trading systems, ATR has always been an important measurement for volatility in the markets. ATR’s are still used for exits in trading systems and sometimes for pre trade risk assessment.
I have created two more indicators around ATR that are discussed in this article.
ATR Bands
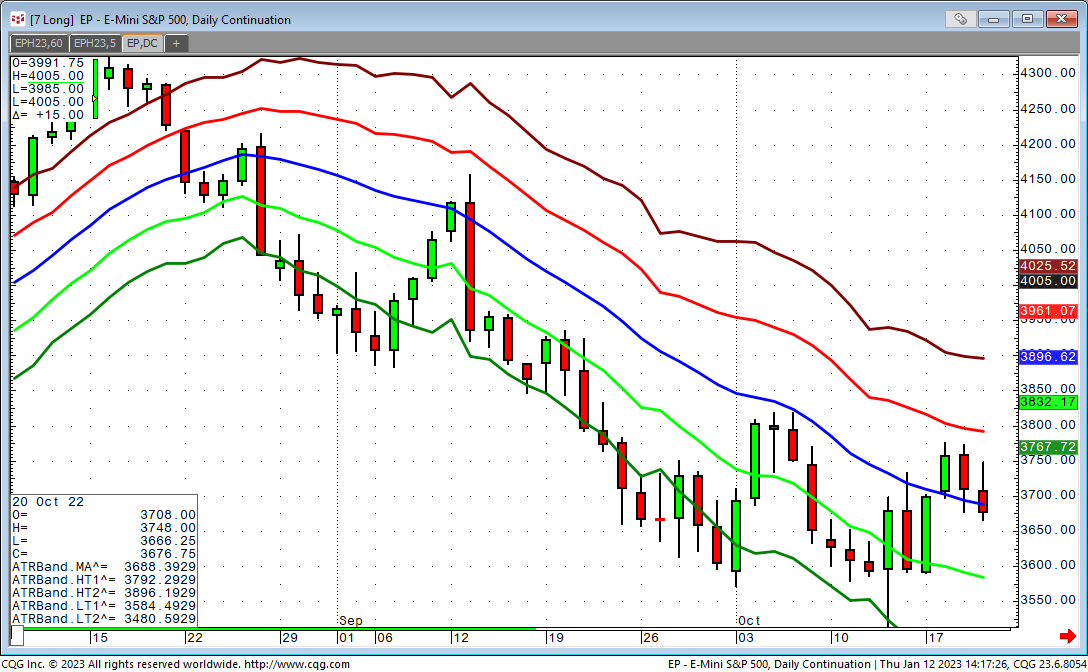
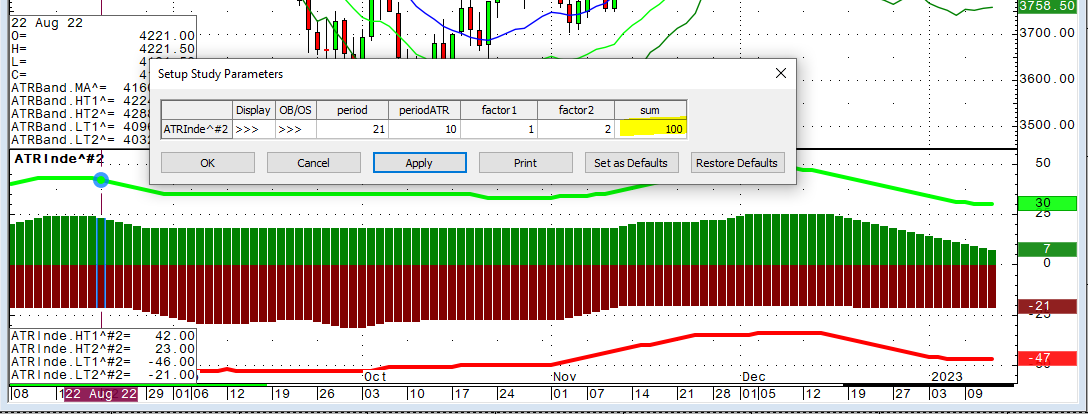
Just like the Bollinger Bands I am using a simple 21 period moving average to smooth out the market movements. Instead of Standard Deviation, I am adding and subtracting one and two times the value of a 10 period ATR.
The length of the MA, the period for the ATR as well as the factors for the two bands can be changed as parameters.
Code:
MA:   MA(@,Sim,period)
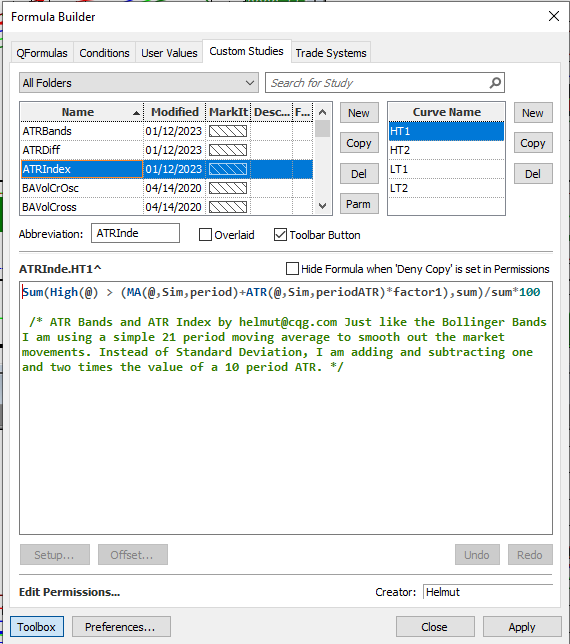
HT1: (MA(@,Sim,period)+ATR(@,Sim,periodATR)*factor1)
HT2: (MA(@,Sim,period)+ATR(@,Sim,periodATR)*factor2)
LT1: (MA(@,Sim,period)- ATR(@,Sim,periodATR)*factor1)
LT2: (MA(@,Sim,period)- ATR(@,Sim,periodATR)*factor1)
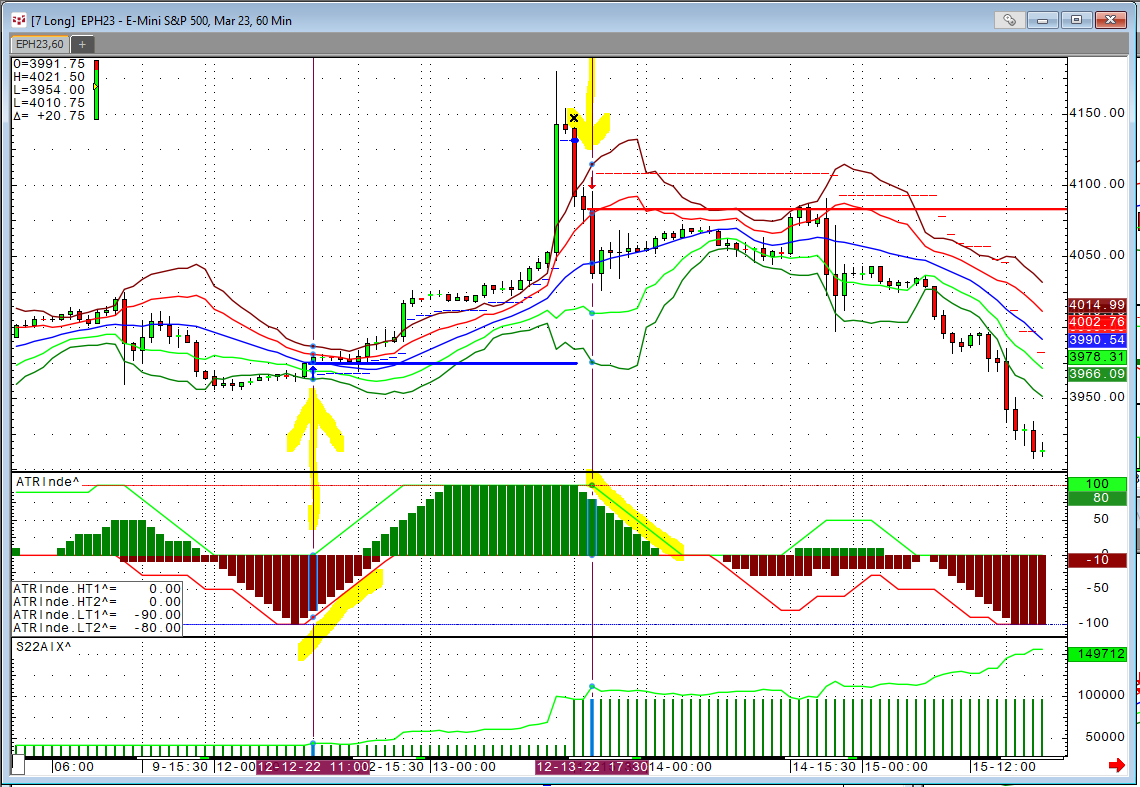
If the candles are away from center MA and move between the first and the second band – sometimes even beyond the second band – that is an indication of a strong trend.
ATR Index
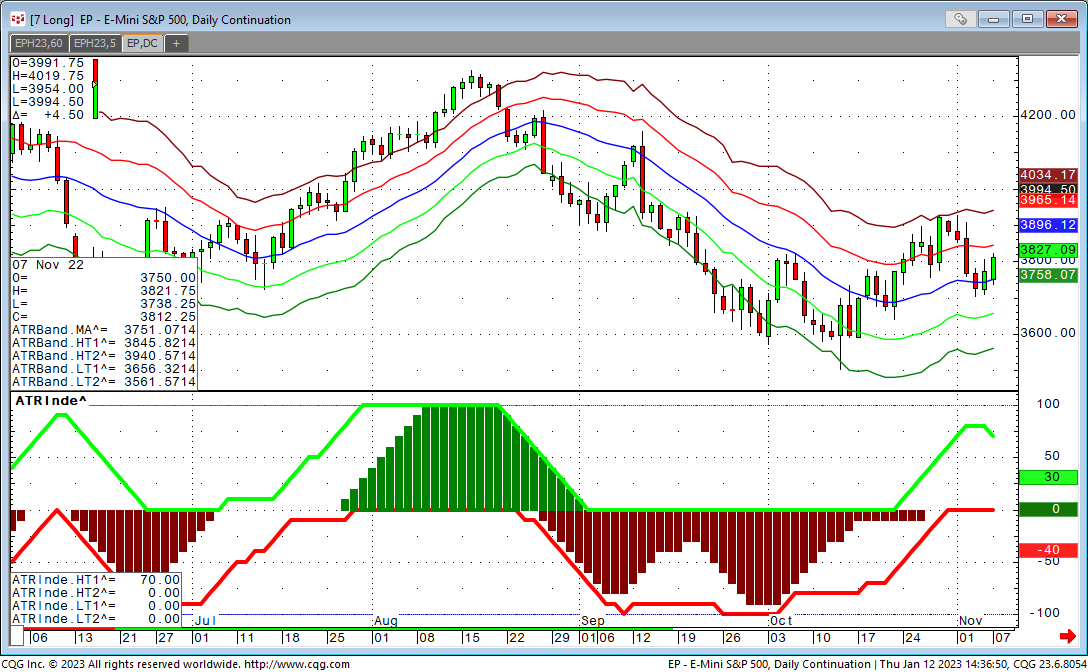
ATR Index is measuring the percentage of highs and lows, over a period of bars being outside the first and outside the second band. Pars are the same as ATR Band plus the sum.
Sample Code:
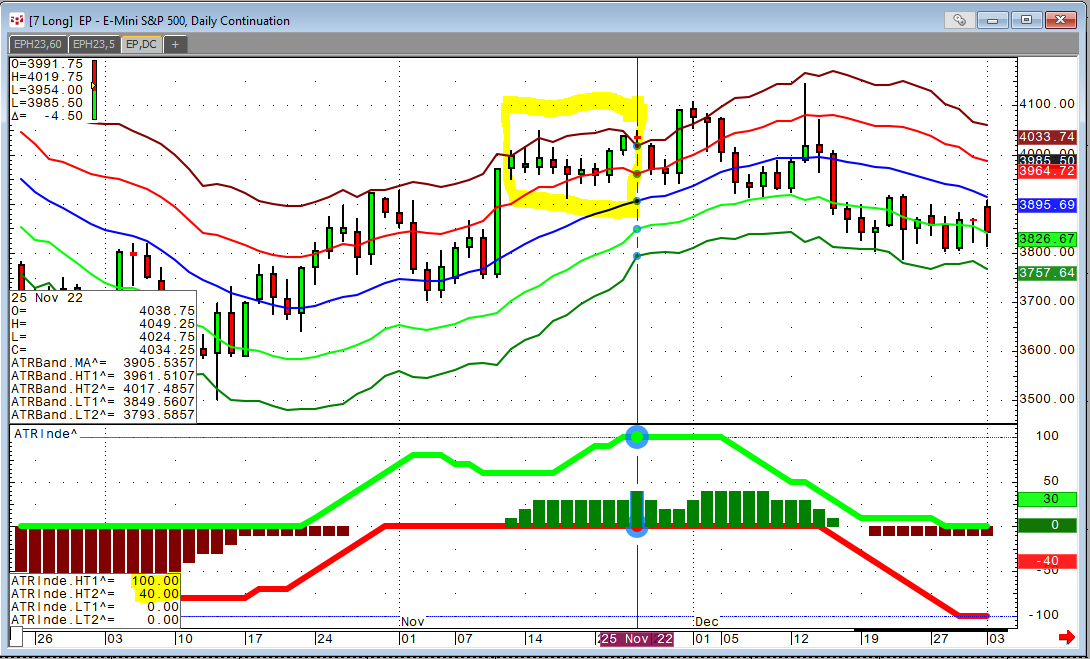
For example: for a lookback period of 10 bars, 100% of the highs have been above the first band and 40% of the bars (4) have been above the second band.
If you measure this over a long period of bars, it seems to become very smooth and does not mark significant events anymore. Stay on small sample size (sum)!
For all the users that are enabled for back testing, you could use these indicators for building trading systems as well.
In this case I am initiating a trade when I have a turn away from a 100% reading.

