Quite some while ago I showed, in a very simple way, how to overlay 2011, 2012, 2013, and 2014 data in one chart. I created two very simple code snippets to accomplish that.
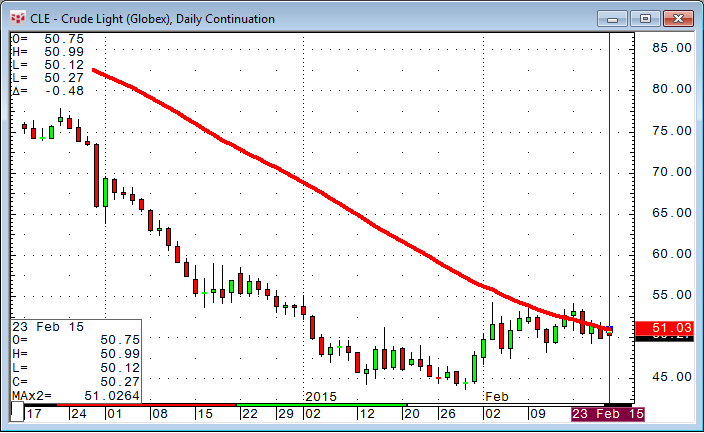
This time, I want to create a moving average that is also a weighted average over past years. For example: today's fifty-day moving average is at 51.03 on crude oil, but what was the value one year ago and what is the average between the two?
The first idea is to simply use an offset of the moving average by the number of trading days last year. How many trading days did we have last year? Is the number of trading days the same every year?
I can measure how many bars we have between the current 2015 bar and the 2014 bar and put that into a variable:
B1514:= BarsSince(Year(@)=2015 AND Year(@)[-1] = 2014,1,10000);
As step two, I want to know how many bars ago we had between 2014 and 2013:
B1413:= BarsSince(Year(@)=2014 AND Year(@)[-1] = 2013,1,10000);
If I now subtract B1514 from B1413, I know how many trading days 2014 had.
OFF1:= SValPropagator(B1413 - B1514);
This is exactly the offset my moving average should have to show me the MA value one year ago.
MA1:=MA(@,Sim,period)[-OFF1];
That was easy. Now I want to do the same for the other years, but after some point it stops giving me the calculations, so I have to tweak the setting of my CQG system a little bit to have more data to calculate this study. Please configure your bar settings to match the following settings:
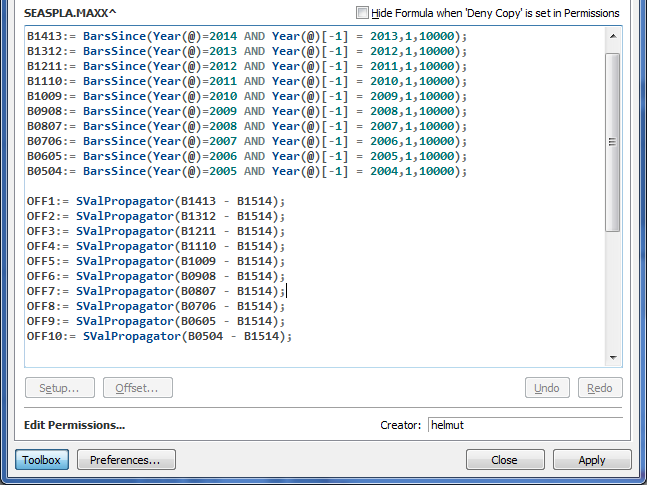
Now I calculate the number of bars back for the last eleven years' changes and then calculate ten different offsets:
I am able to offset any moving average by the number of days I had calculated. To calculate the average value of these ten moving averages, I put each one again into a variable and add them up.
MA:=MA(@,Sim,period);

MA1:=MA(@,Sim,period)[-OFF1];

MA2:=MA(@,Sim,period)[-OFF2];

MA3:=MA(@,Sim,period)[-OFF3];

MA4:=MA(@,Sim,period)[-OFF4];

MA5:=MA(@,Sim,period)[-OFF5];

MA6:=MA(@,Sim,period)[-OFF6];

MA7:=MA(@,Sim,period)[-OFF7];

MA8:=MA(@,Sim,period)[-OFF8];

MA9:=MA(@,Sim,period)[-OFF9];

(MA + MA1 + MA2 + MA3 + MA4 + MA5 + MA6 + MA7 + MA8 + MA9)/10
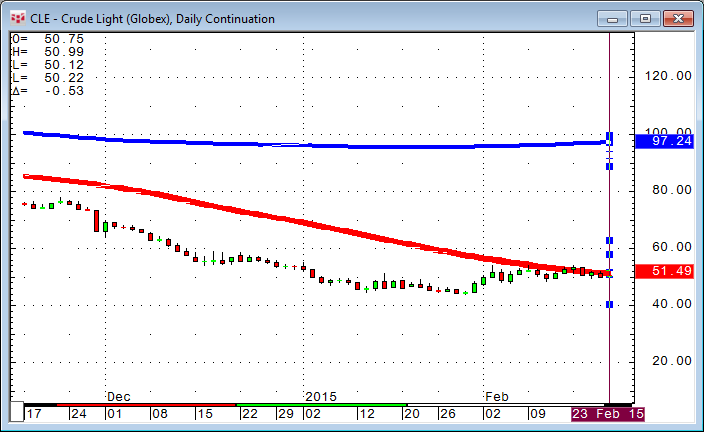
This way I can create all ten moving averages separately (light grey lines) and the average of the ten MAs (red) in one study.
The only parameter missing so far is the length of the moving average. One of the ideas was to be able to actually weigh the different moving averages in a certain way. Maybe last year's MA is more important than the one two years ago and so on.
I found a very pragmatic way to do any weighing I want:
First I create ten variables (Parms) for the different MA's being a simple integer.
Then I multiply the output of any MA by its weighting average:
(MA * W1 + MA1 * W2 + MA2 * W3 + MA3 * W4 + MA4 *W5 + MA5 * W6 + MA6 * W7 + MA7 * W8 + MA8 * W9 + MA9 * W10)
At the end, I need to sum up the weightings and divide the first calculation by the total amount of weightings:
(MA * W1 + MA1 * W2 + MA2 * W3 + MA3 * W4 + MA4 *W5 + MA5 * W6 + MA6 * W7 + MA7 * W8 + MA8 * W9 + MA9 * W10)/(W1 + W2 + W3 + W4 + W5 + W6 + W7 + W8 + W9 + W10)
The benefit of this simple method over percentages is that I don't have to worry about the sum ending up being exactly 100%. You are free to put any value to any MA and the result will always be mathematically correct.
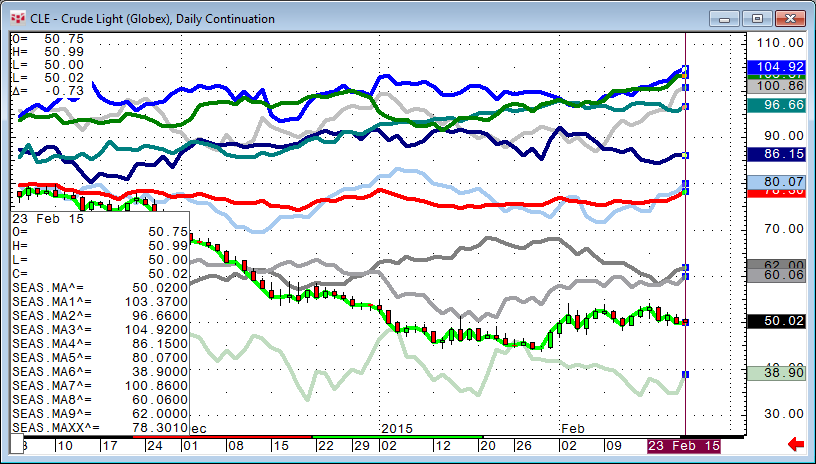
Here is a little side effect of this study: If I change the moving average period to one and modify the curves to different and thicker colors, I actually end up with ten years' seasonal overlay of the market date.
A moving average of one is actually equal to the close of the bar.
The red line is still the average of all 10 MAs.
I have included a pac so you do not need to rebuild the whole study on your own.
Please send me any questions or suggestions.


