A long time ago, I wrote two articles about divergence for our CQG blog that are probably still worth reading. Especially in the second article, I was using peaks on the indicators to measure price behavior on these points. I.e. if the indicator makes a new high, but the price data does not the coding marks this kind if divergence.
- https://news.cqg.com/blogs/coding/2014/11/divergence-index
- https://news.cqg.com/blogs/coding/2015/02/divergence-part-2
In this new approach – that is not very different from the second one – we are just doing it the other way around. We are looking for significant highs and lows on the market data first, and then comparing it with the indicator of your choice.
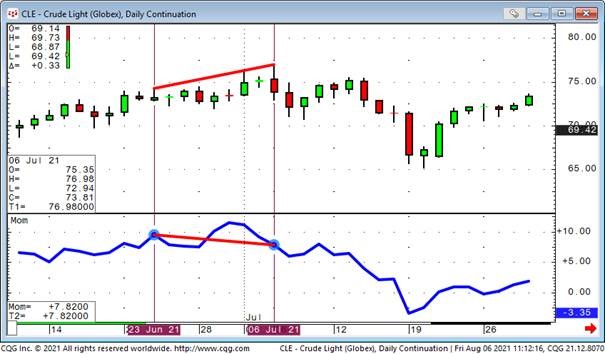
As step number one, I created a simple condition to identify the price points I want to use for measurement.
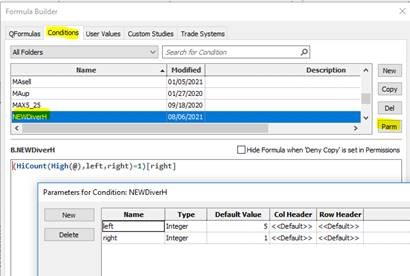
(HiCount(High(@),left,right)=1)[right]
The condition has two parms – left and right. So in this condition, a new significant high is a high that is higher than the previous n highs (the default is 5) and it has n lower highs to its right (default is 1). I need to offset the marker by the number of right bars in order to mark the actual high.
This first condition is not the actual signal, its just a small helper to get the further programming correct and to see all measurement points. The condition used for the actual divergence is a little bit more complex.
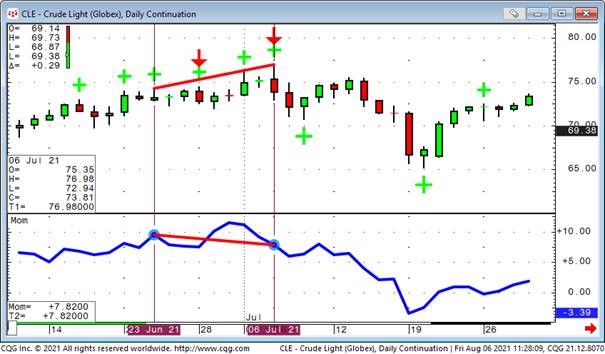
STUDY:=Mom(@,28
PRICE:= High(@) WHEN (HiCount(High(@),left,right)=1)[right];
INDICATOR:= STUDY WHEN (HiCount(High(@),left,right)=1)[right];
TRIGGER:= (HiCount(High(@),left,right)=1)[right] AND PRICE > PRICE[-1] AND INDICATOR  INDICATOR[-1];
The first variable STUDY is the study we use to compare the readings. This way you can simple exchange the study you want to use for the divergence. PRICE now records the value of the high when the hicount condition is true. INDICATOR records the value of the indicator when the hicount condition is true.
TRIGGER now is our boolean that needs to have 3 thing connected together:
- The hicount condition is true
- The price is greater than one reading before
- The indicator reading is less than one reading before
This is divergence. The logic of the lows is just reversed.
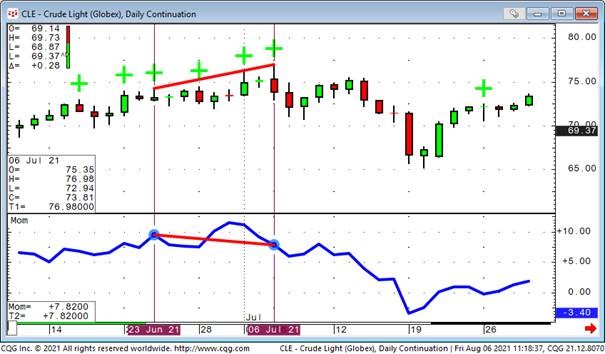
As an additional “helper”, I also created a peak study that records and plots the values of price and indicator.
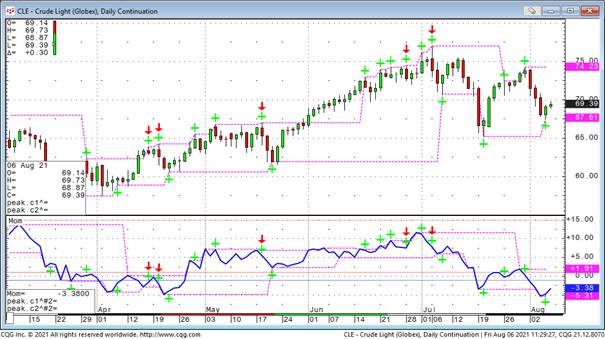
Keep in mind that there is a delay driven by the number of bars to the right. We only know that the peak is actually a peak if it has n lower bars to its right. Therefore we need to wait these number of bars (days) till the condition is confirmed true.
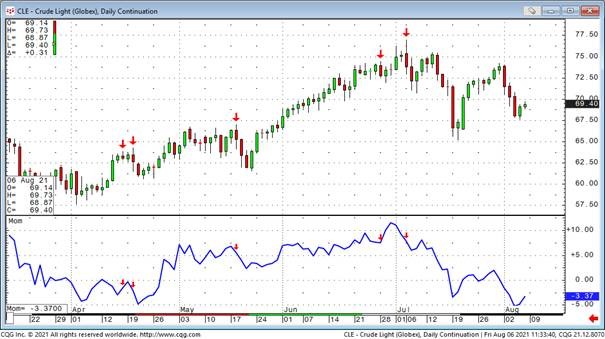
If this is to noise with all the markings on the chart – all you need is the actual signals.
In order to use another study than momentum you just need to substitute the “study” in each condition by the one you want. For example RSI.
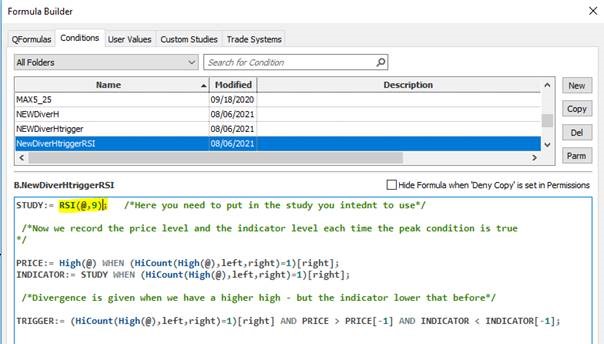
I would recommend creating copies of the original one for the different studies you want to use.
Feel free to download the whole pack for your reengineering.