In late June 2020, the nearby natural gas futures price fell to its lowest level in twenty-five years when it reached $1.432 per MMBtu. Days after the low, Warren Buffett announced that Berkshire Hathaway acquired transmission and pipeline assets from Dominion Energy for $4 billion in cash and $6 billion in assumed debt. The value investor’s purchase was a vote of confidence for the natural gas market as the price just reached a quarter-of-a-century low. Whether serendipitous or not, the news during the first week of July lit a bullish fuse under the energy commodity. Natural gas futures made higher lows and higher highs over the next four months and over doubled in price.
Volatility is nothing new for the natural gas market that has traded in a range from $1.02 to $15.65 per MMBtu over the past three decades. We are now at the beginning of the peak season for demand each year as heating demand rises during the winter months. Over the coming weeks and months, seasonality, inventories, and politics will dictate the path of least resistance of the price of the energy commodity.
A steady bullish move from late June until late October
The price of nearby NYMEX natural gas futures moved steadily higher from late June through late October.
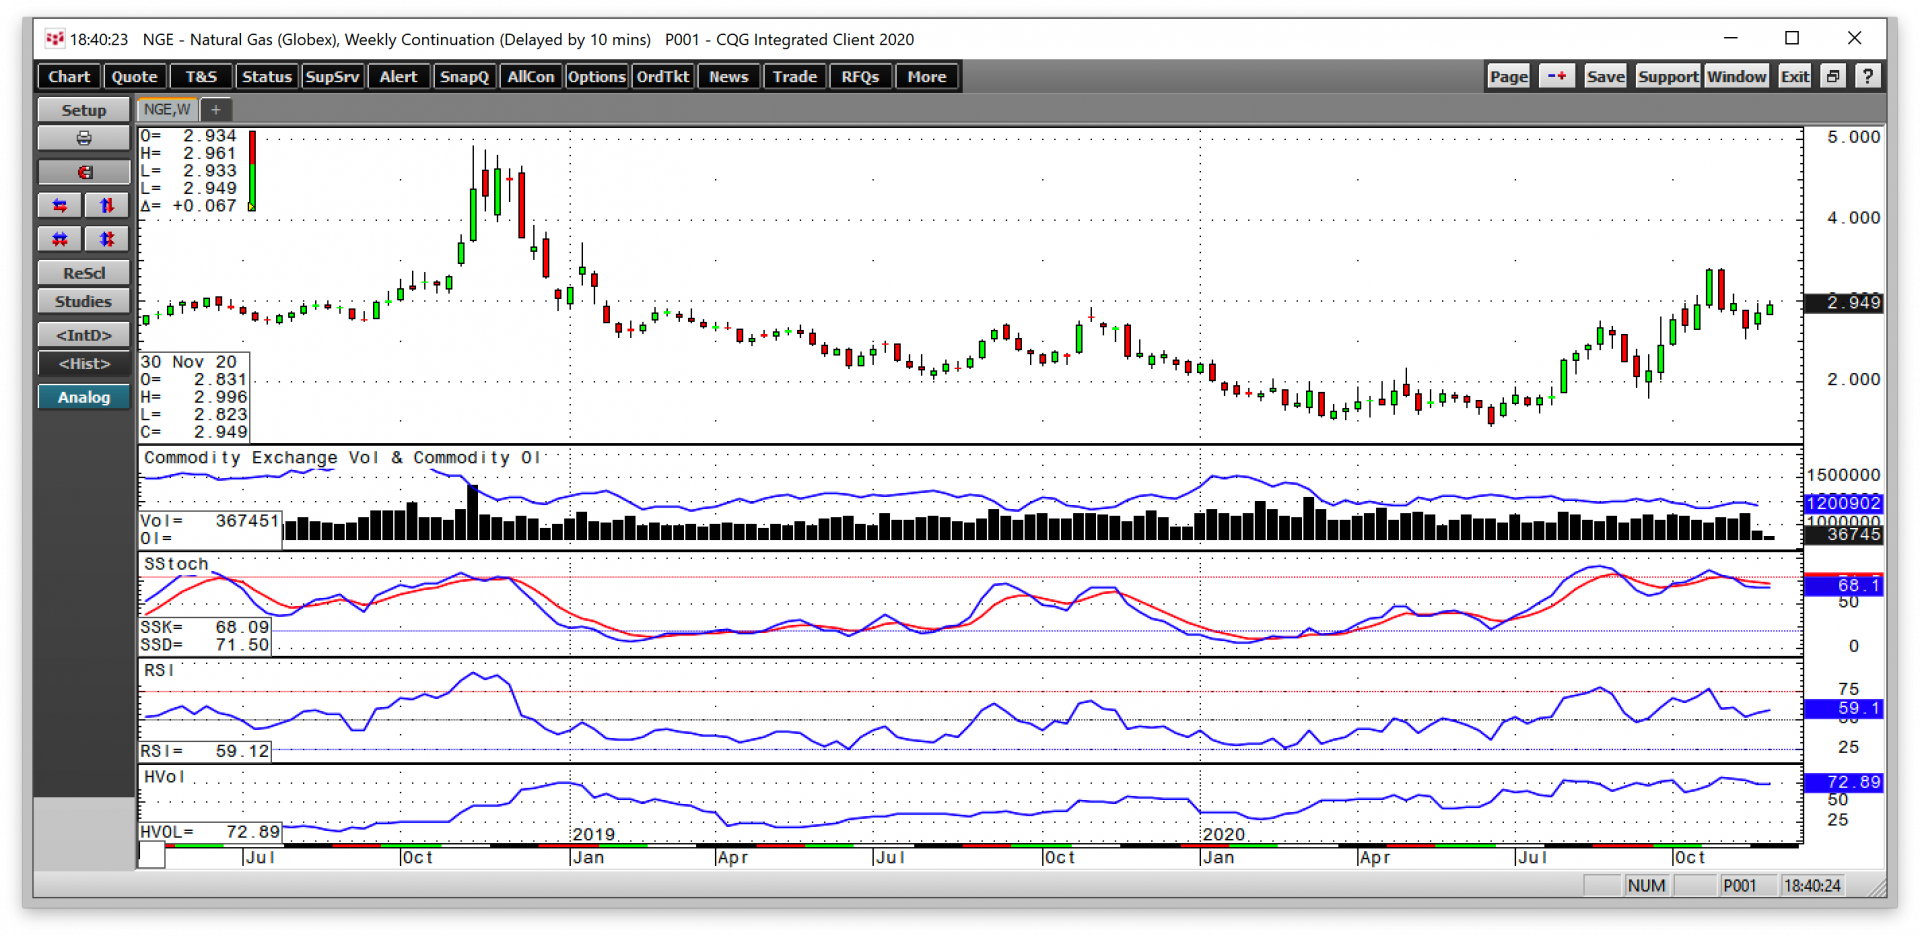
The weekly chart highlights the rally from $1.432 to $3.396 or over 137% over four months. Open interest, or the total number of open long and short positions in the natural gas futures market, fell from 1.317 million to 1.173 million contracts from the day natural gas reached the low to the day it peaked. The decline in open interest reflects closing risk positions and hedges and is not typically a validation of a futures market trend. Price momentum and relative strength indicators moved from oversold to overbought conditions over the course of the rally. Broader weekly trading ranges lifted weekly historical volatility from below 50% in late June to 80% when the price reached its peak.
Selling returns in November
The rally in natural gas ended on the final trading day of October.

The daily chart of the active month January futures contract illustrates that natural gas rose from a low of $2.778 in late June. The $1.346 premium reflects seasonality. January is the month when heating demand in the US tends to peak. The price rose by 26.2% to the October 30 high. In November, natural gas for January delivery fell below its late June low, reaching $2.656 on November 19, a decline of 24.3%. The open interest metric rose as the price was falling, moving from 1.173 million contracts on October 30 to 1.252 million contracts on November 19 as more speculators and hedgers flocked to the natural gas market. Daily price momentum and relative strength indicators declined to oversold readings when the energy commodity hit its low on November 19. Daily historical volatility rose to the 57% level at the end of November. The metric that measures price variance has been steadily rising since mid-October.
A lot is going on in the natural gas market from a short and long-term perspective. The weather is always the most significant factor as we enter the winter season. However, in 2020, stockpiles and politics could be a lot more influential than Mother Nature.
An early rally and an early dip
In November 2018 and 2019, the natural gas price reached its peak for the winter season at $4.929 and $2.905, respectively. In November 2020, the price action was bearish as the price gave up gains from the past months. The high in October 2020 came early compared to the past two years. The selling in November was also premature.
Natural gas tends to be highly volatile as the winter approaches. Meanwhile, increased price variance could hang around a lot longer than usual over the coming weeks and months as bullish and bearish factors pull the price of the energy commodity in opposite directions.
The bear case for natural gas
The bearish argument for natural gas starts with inventories. Stockpiles of the energy commodity in storage at the end of the 2020 injection season stood at 3.958 trillion cubic feet. There were 226 billion cubic feet more natural gas in the US in late 2020 than at the same time in 2019. Last year, the energy commodity only made it to a high of $2.905 per MMBtu in November as the high level of supplies weighed on the price. In late 2018, the peak in stocks was at 3.234 tcf, 724 bcf above this year. In November 2018, the price of natural gas rose to a high of $4.929 on the lowest inventories in years. As we head into the 2020/2021 withdrawal season, there is plenty of natural gas in the US to meet all requirements, even if it is a colder than average winter.
Another compelling reason for weak natural gas prices over the coming months is the ongoing global pandemic. The coronavirus has weighed on energy demand in the US and worldwide as business contracted. With the number of infections and fatalities rising in the US, Europe, and other areas of the world, the overall demand for natural gas is likely to remain at low levels over the coming months.
Nearby NYMEX natural gas reached a peak of $3.396 per MMBtu at the end of October. The high came early as it usually occurs in November or during the winter months during colder than average years when stocks decline. January futures settled at $2.882 on November 30.
The bull case for natural gas
The bullish case for the energy commodity could be all about politics in 2021. On January 5, voters in Georgia will go to the polls to elect two Senators after no candidates reached the 50% threshold in the November 3 election. The balance of power in the Senate now stands at forty-eight Democrats and fifty Republicans. A pair of victories by Democrats in Georgia would create a 50-50 tie. Vice President-elect Harris would be the tie-breaking vote, throwing the majority into the hands of the Democrats. Senator Chuck Schumer would replace Senator Mitch McConnell as the majority leader.
President-elect Joe Biden would have a majority in the House and Senate, creating clear sailing for his agenda. Democrats favor a greener approach to energy production in the US. The party’s progressive wing advocates tightening regulations that limit or ban fracking, which could cause US natural gas output to plunge. Lower production would be highly supportive of the price of the energy commodity over the coming months and years. Natural gas has replaced coal in electricity generation. A burgeoning export business, sending natural gas in liquid form to destinations worldwide by ocean vessel is a new and growing demand channel for gas. Control by Democrats would likely foster a greener path. If Republicans maintain control of the Senate, the President will need to compromise on legislative plans. Therefore, the price path of natural gas is on the ballot on January 5 in Georgia.
Meanwhile, according to Baker Hughes, 77 natural gas rigs were operating in the United States as of November 25. In late November 2019, 131 rigs were in operation. The decline of 54 rigs weighs on output. Natural gas inventories are higher this year because of the lower level of demand caused by the coronavirus. A vaccine in the coming months will likely increase the need for the energy commodity. Higher requirements when US energy policy shifts away from fossil fuels could create shortages in the coming months and years.
Natural gas typically rallies to highs during the winter months as it has a history as a seasonal commodity. However, 2020 is a year like no other. The pandemic and political shifts in the US could cause volatility to continue over the coming months as seasonality takes a backseat to other factors.