Commodity prices have been trending higher since reaching lows in March and April 2020. Over the first six months of 2021, a composite of the asset class was up over 20%. In May, lumber, copper, and palladium prices reached all-time highs. While the three industrial commodities corrected from their peaks, the bullish baton passed to another set of commodity futures. In late June, coffee rose to its highest price since October 2014 at over $2 per pound.
Meanwhile, energy commodities have made higher lows and higher highs since reaching bottoms in 2020. NYMEX crude oil traded to its lowest price even when the nearby futures contract fell below zero and a low of negative $40.32 per barrel on April 20, 2020. Brent futures traded to a century low at $16 per barrel. Natural gas, the combustible and volatile energy commodity, reached $1.432 per MMBtu in late June 2020. Coal and ethanol prices reached significant bottoms.
In July 2021, energy prices have made an incredible comeback. All signs point to even higher price levels as the energy sector holds the baton in the bullish relay race in the commodities asset class.
A speed bump in crude oil allows the elevator to stop at a higher floor
After trading to the lowest price in history in April 2020, NYMEX crude oil reached a milestone on July 6, 2021, when it traded at $76.98 per barrel.
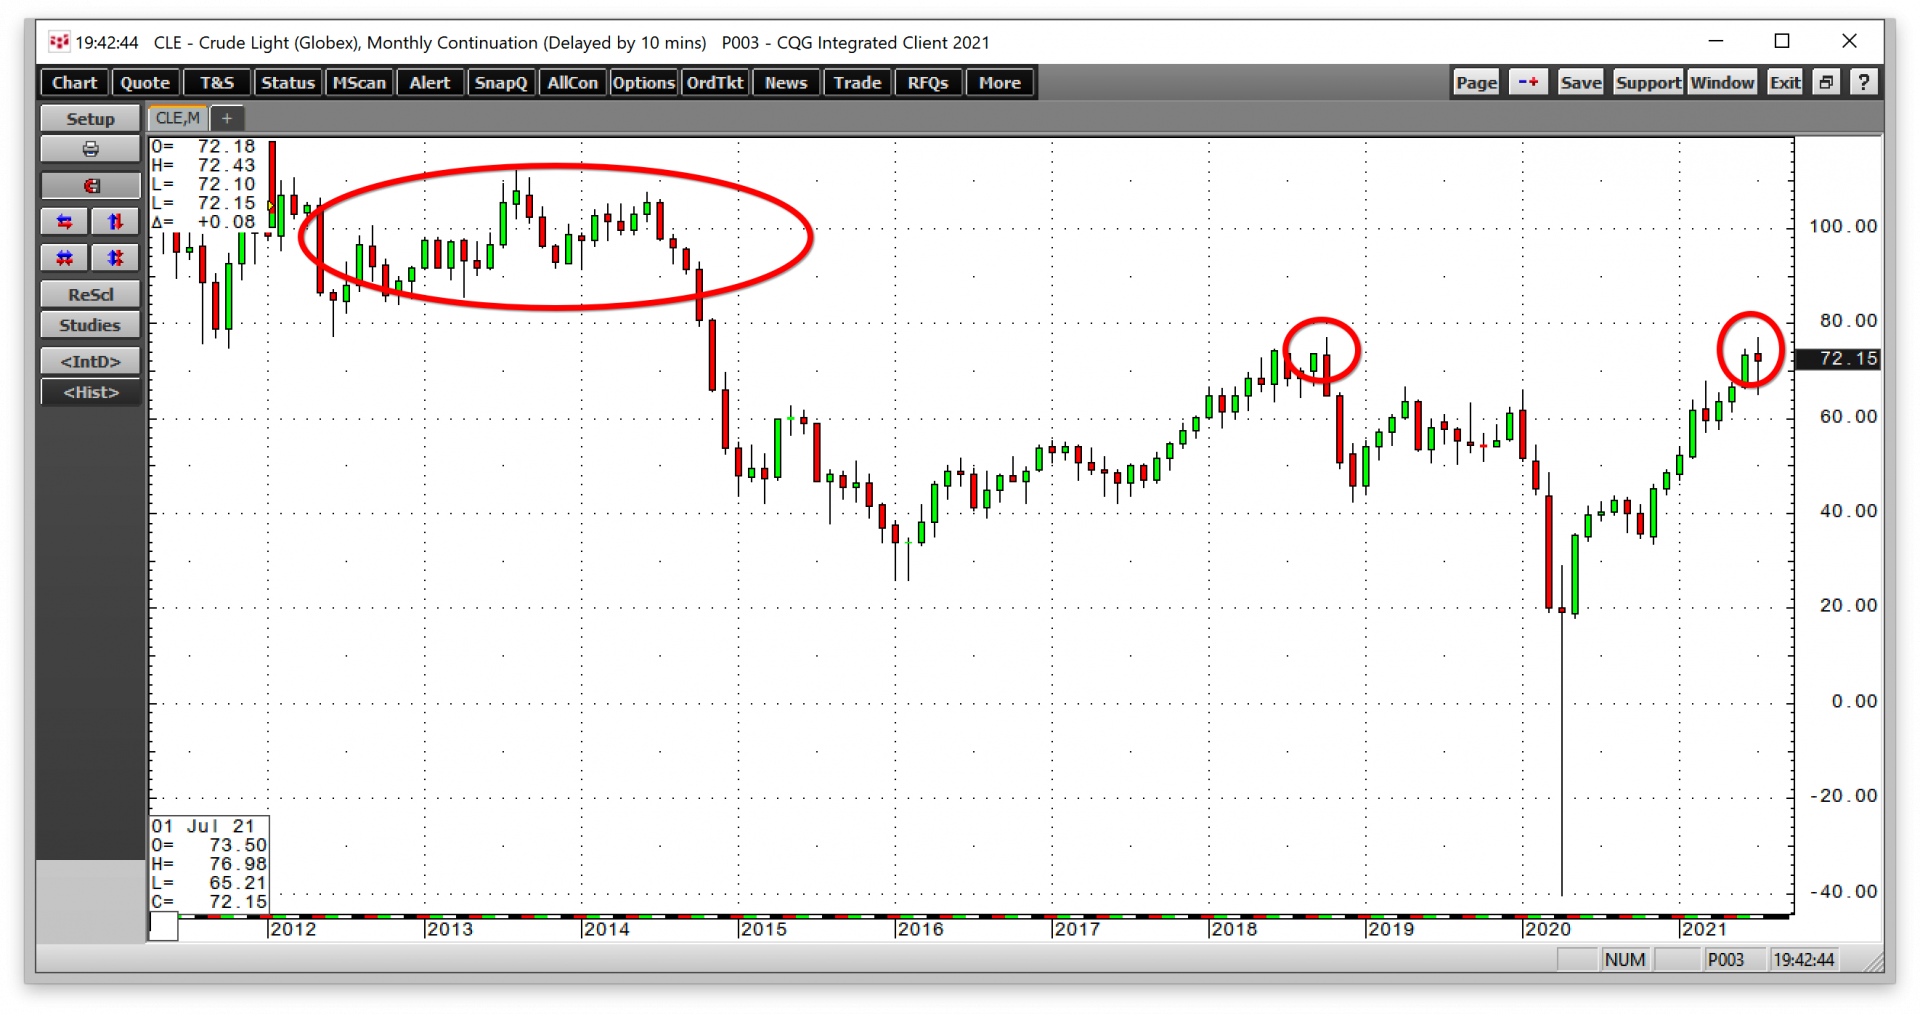
The monthly chart highlights the early July high surpassed the October 2018 peak by eight cents per barrel and rose to the highest level since 2014, the year WTI futures last eclipsed the $100 per barrel level.
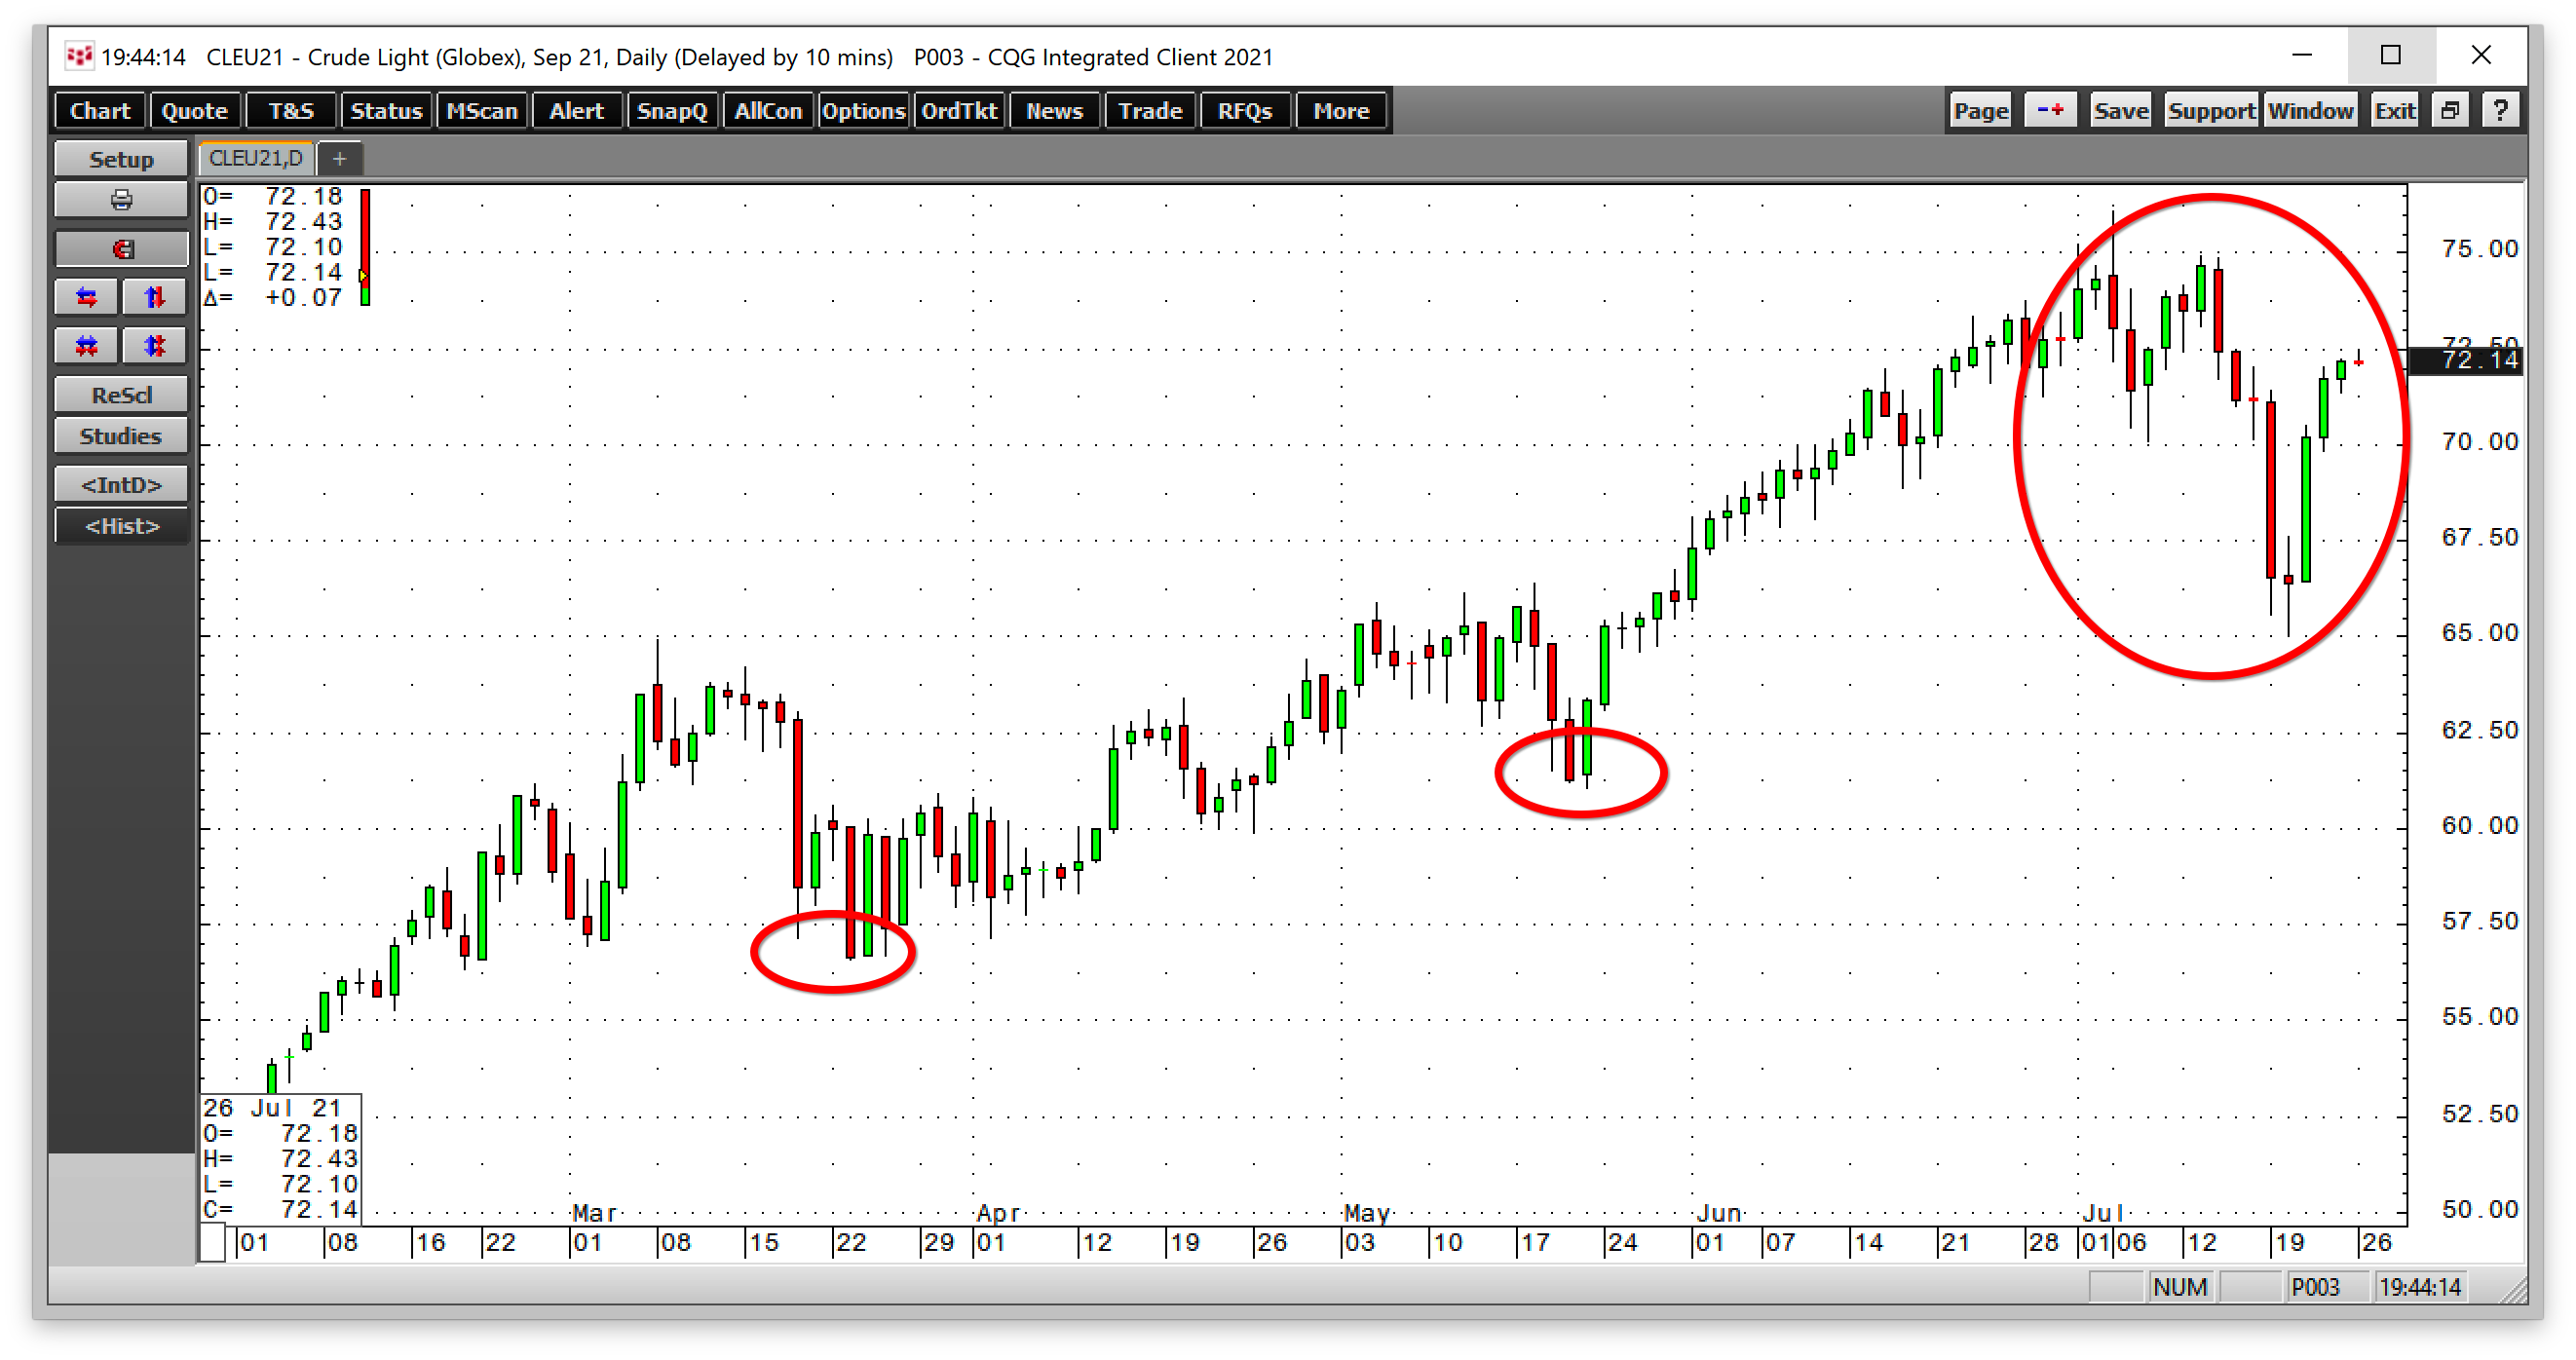
The daily chart of nearby September NYMEX futures shows the slightly lower high at $76.07 and the correction that took crude oil to a low of $65.01 on July 20 after taking an elevator lower on July 19. Crude oil tends to take the stairs higher and an elevator shaft lower when it corrects. It took from May 4 through July 6, over two months to climb from below $65 to the recent high. In only two weeks, the price gave up the gain. However, the elevator stopped at a higher floor, crude oil made a higher low, and the price snapped back above the $72 per barrel level by July 26.
A correction in crude oil was overdue, given its steady gains over the past fifteen months. News that OPEC+ agreed to taper production cuts, increasing COVID-19 delta variant cases, and a brief bout of selling in the stock market pushed the energy commodity lower. However, it’s hard to keep a bull market down, and the energy commodity showed lots of resilience with the bounce back over the $70 level that day after it hit the low on July 20.
The bull charges higher in natural gas
Natural gas, the volatile, combustible, and wild energy commodity that trades on the CME’s NYMEX division, has ignored seasonality by climbing to a multi-year high. In late July, the price eclipsed the $4 per MMBtu for the first time since late 2018. Moreover, natural gas had not seen a price over four bucks in July in seven years.

The monthly chart illustrates natural gas reached a high of $4.071 per MMBtu on July 23. In 2018, the last time natural gas traded over the $4 level, the price made it up to $4.929. In 2014, when the price was above $4 in July, it was on its way down from the $6.493 per MMBtu peak in February of that year.
Natural gas has nearly tripled since reaching a quarter-of-a-century low at $1.432 per MMBtu in late June 2020. At that time, value investor Warren Buffett spent $10 billion buying natural gas storage and pipeline assets from Dominion Energy (D). The deal expanded Berkshire Hathaway’s control of US natural gas transmission from 8% to 18%. Warren smelled a bargain at the lowest price since 1995, and the energy commodity delivered. During the peak cooling season, hot temperatures have lifted natural gas, but there is a much more powerful force pushing traditional energy commodity prices higher these days.
Ethanol and coal prices are at multi-year peaks
Ethanol has also moved to a multi-year high in 2021. The illiquid ethanol futures market rose to the $2.48 per gallon wholesale level in July.
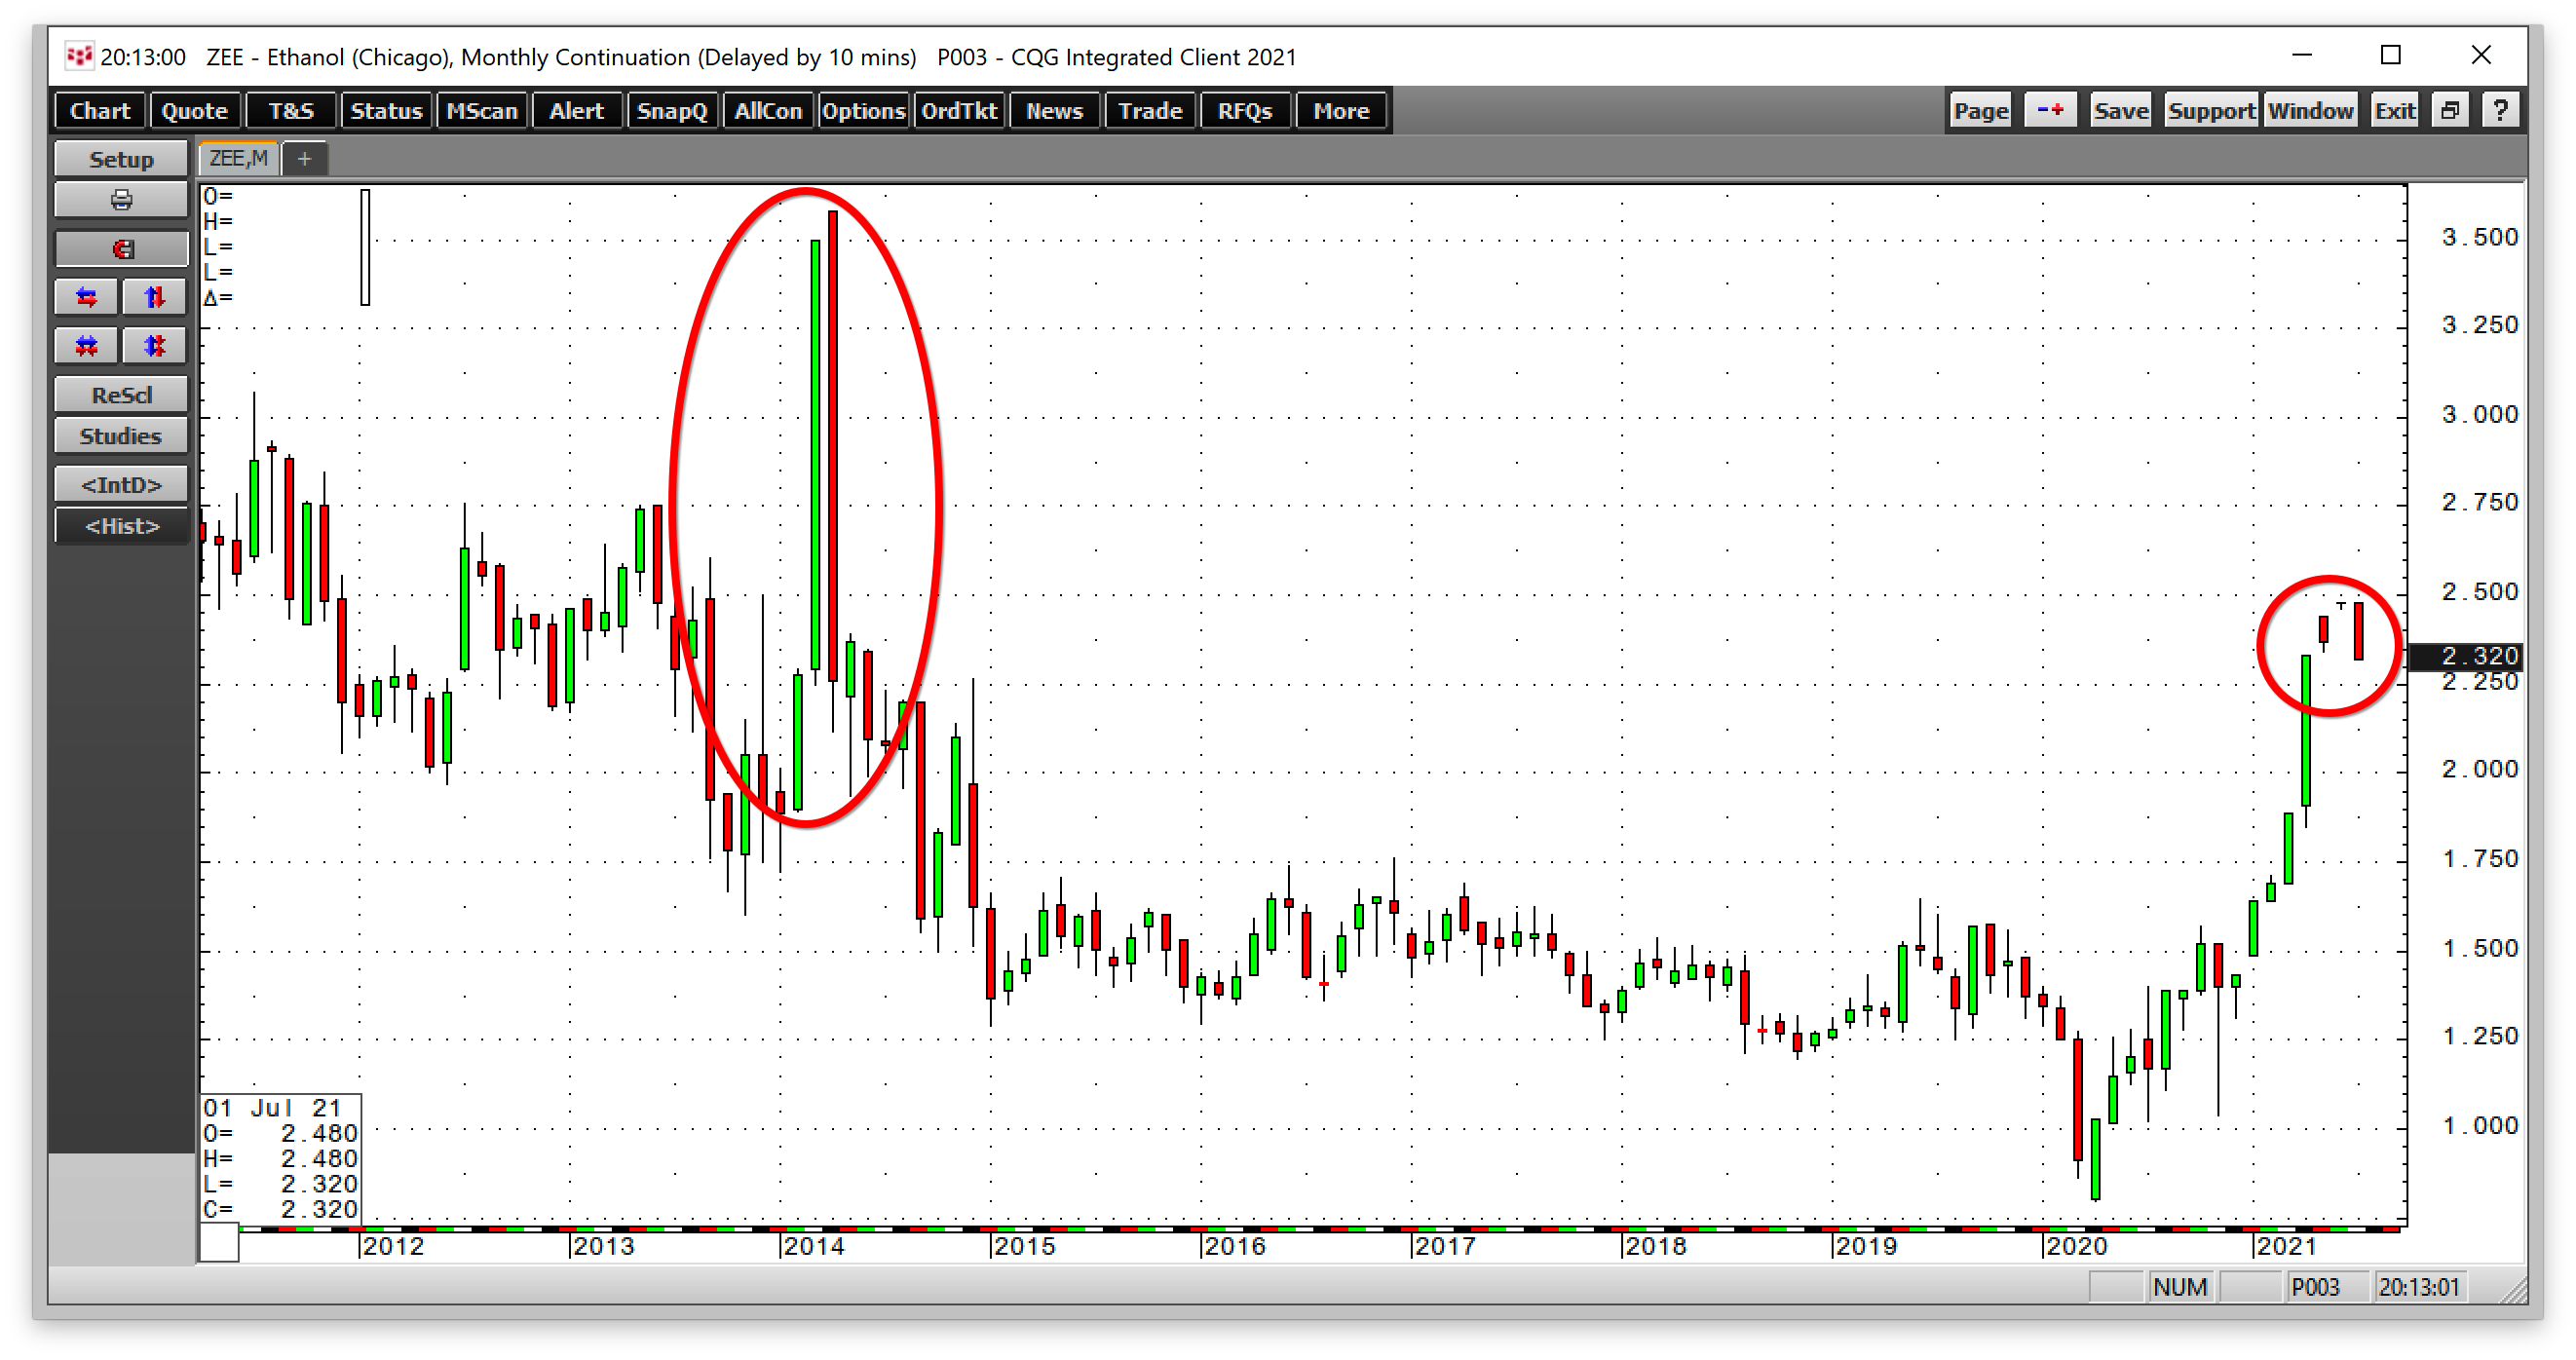
The monthly ethanol chart shows the rise to the highest price since April 2014. Crude oil, natural gas, and biofuels were not the only energy commodities that soared so far in 2021.
Coal has been a four-letter word in the energy sector for years. Many companies have gone out of the coal mining business. In the US, power production has switched from coal-fired to natural gas-fired generation. However, China and India, the world’s most populous nations, continue to burn coal to produce power. The nearby thermal coal futures contract for delivery in Rotterdam, the Netherlands, rose from a low of $38.45 per ton in April 2020 to its most recent high of $133.50 this month. While natural gas reached the highest price since 2018, oil rose to its peak level since 2014; coal did even better. The coal price had not traded above the $133.50 level since October 2008.
The bullish price action in energy commodities is an extension of the inflationary central bank liquidity and government stimulus pouring into the financial system for more than a year. The June CPI data shows a 5.4% increase in inflation, with a 4.5% rise in core inflation, excluding food and energy prices. Two other factors are turbocharging energy prices over the past months.
US energy policy underpins prices
On his first day in office, US President Joe Biden canceled the Keystone XL pipeline project that carries petroleum from the oil sands in Alberta, Canada, to Steele City, Nebraska, and beyond to the NYMEX delivery point at the Cushing, Oklahoma pipeline network. In May, the Biden administration banned drilling and fracking for oil and gas in Alaska. Regulatory reforms for fossil fuels are on the horizon as the US has embarked on a greener path leading to decarbonization. Meanwhile, most cars, trucks, planes, and other modes of transport continue to require hydrocarbons for power.
According to the Energy Information Administration, US crude oil production declined from a record 13.1 million barrels per day in March 2020 to 11.4 mbpd as of July 16, a 13% drop. The shift in US energy policy has handed pricing power in the oil market back to OPEC and the Russians on a silver platter. In natural gas, the growing demand vertical created by the LNG market has caused the energy commodity to move beyond the pipeline system. Liquefied natural gas now travels worldwide via ocean vessels to regions where the price is higher than in the US, tightening the supply-demand fundamentals in the natural gas market.
US energy policy has turbocharged price action by limiting supplies.
Robust demand makes for a perfect bullish storm
Restrictions on supplies have come when demand is expanding dramatically as vaccines create herd immunity to the worst consequences of COVID-19. People are returning to work. They are traveling and venturing out, putting more miles on cars, trucks, planes, and all transportation modes.
So far in 2021, the inventory data in the oil and gas markets spotlight the rising demand for fossil fuels.
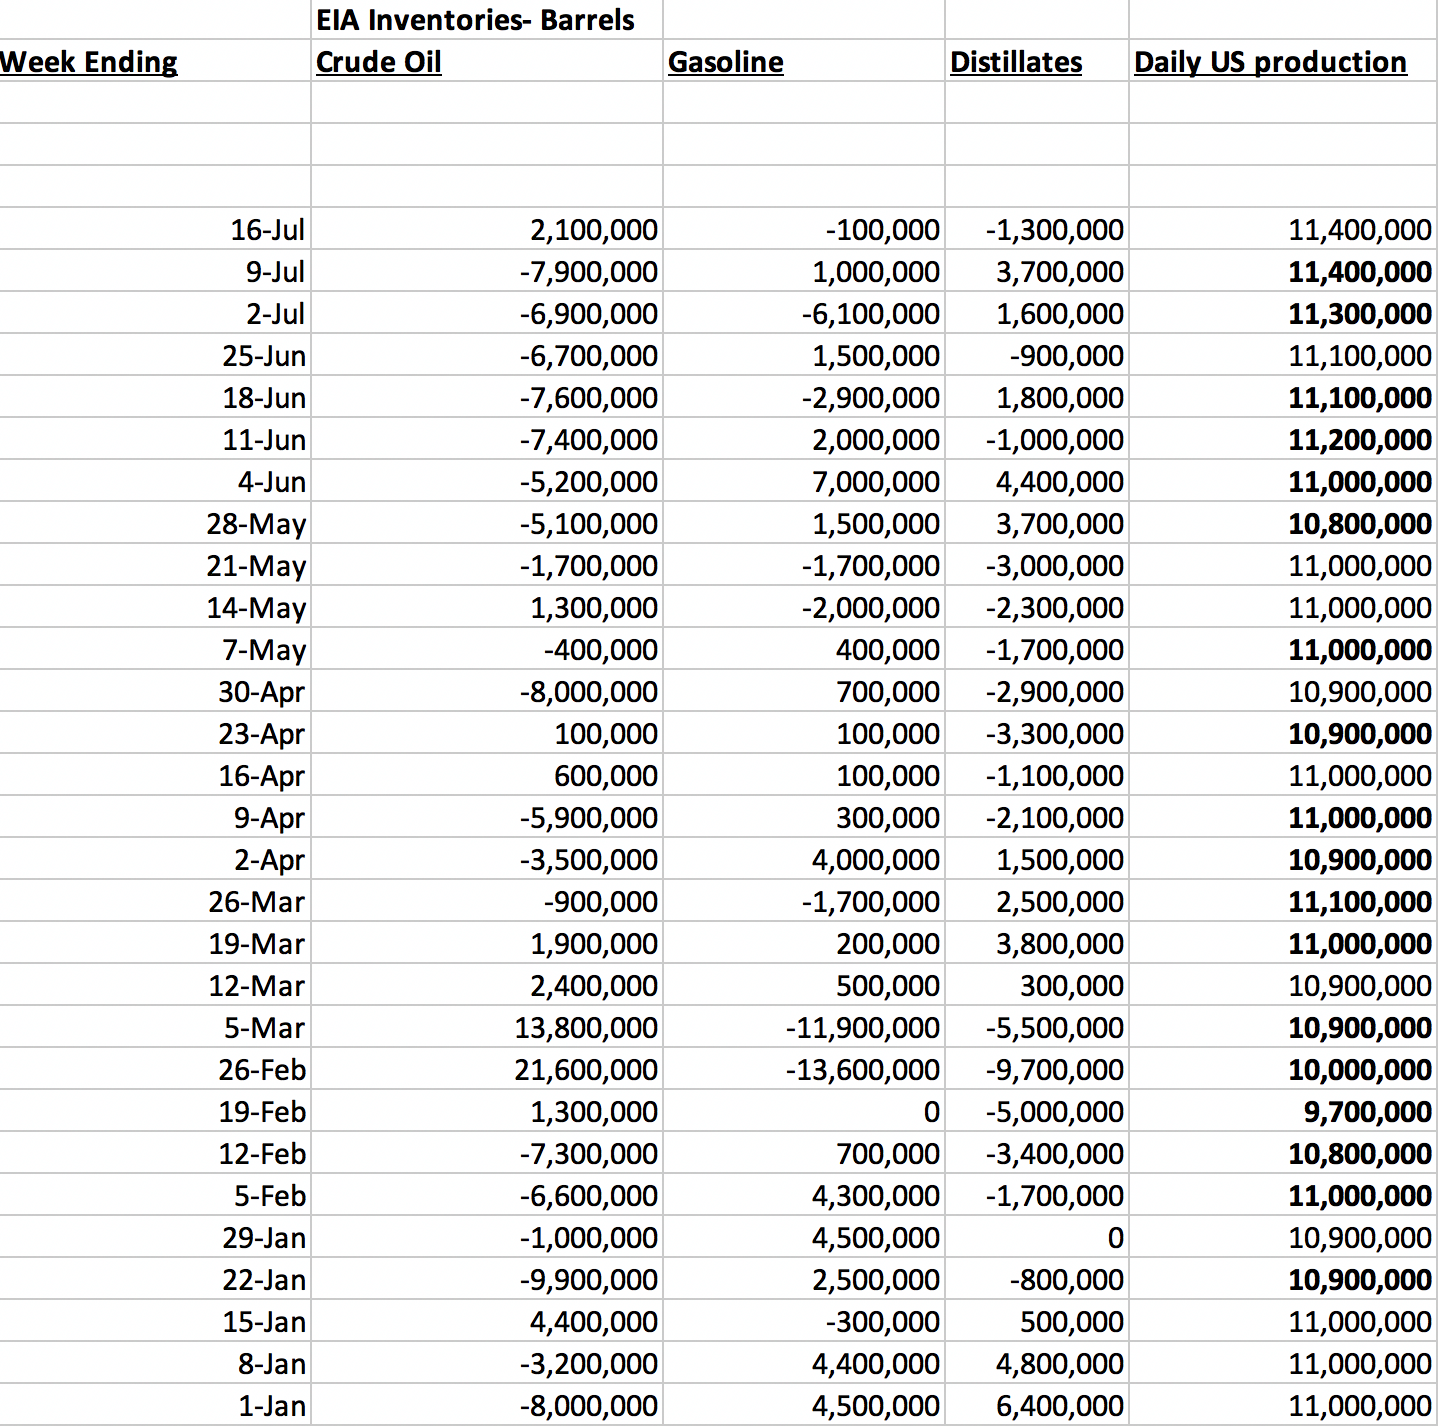
Source: EIA
As the chart highlights, US crude oil inventories declined by 53.7 million barrels, gasoline stocks dropped by 100,000 barrels, and distillate stockpiles moved 10.7 million barrels lower from January 1, 2021, through July 16, 2021. While inventories have moved lower, daily production only edged 3.6% higher, not keeping pace with the robust demand.
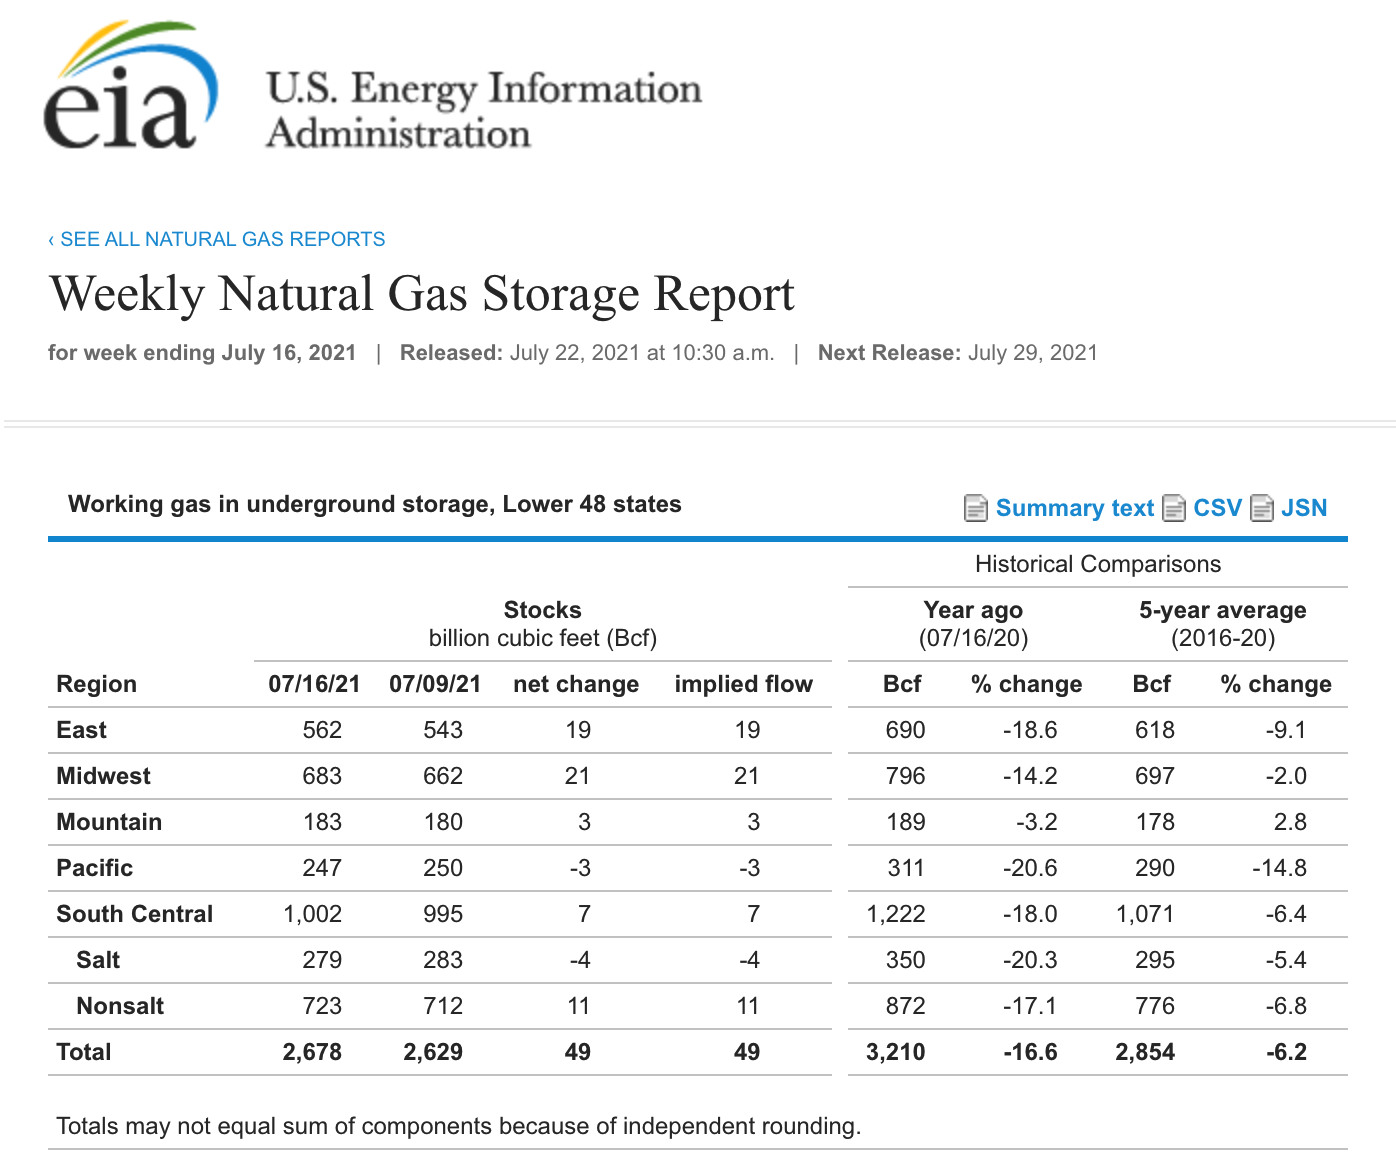
Source: EIA
As of July 16, 2.678 trillion cubic feet of natural gas was sitting in storage across the US, 16.6% below last year’s level and 6.2% under the five-year average for mid-July. The bottom line is that energy prices continue to trend higher, supported by fundamental and technical factors. The bull market in commodities is a relay race with one set of raw materials handing the bullish baton to another. Energy continues to move higher, and in all markets, the trends are always your best friends.