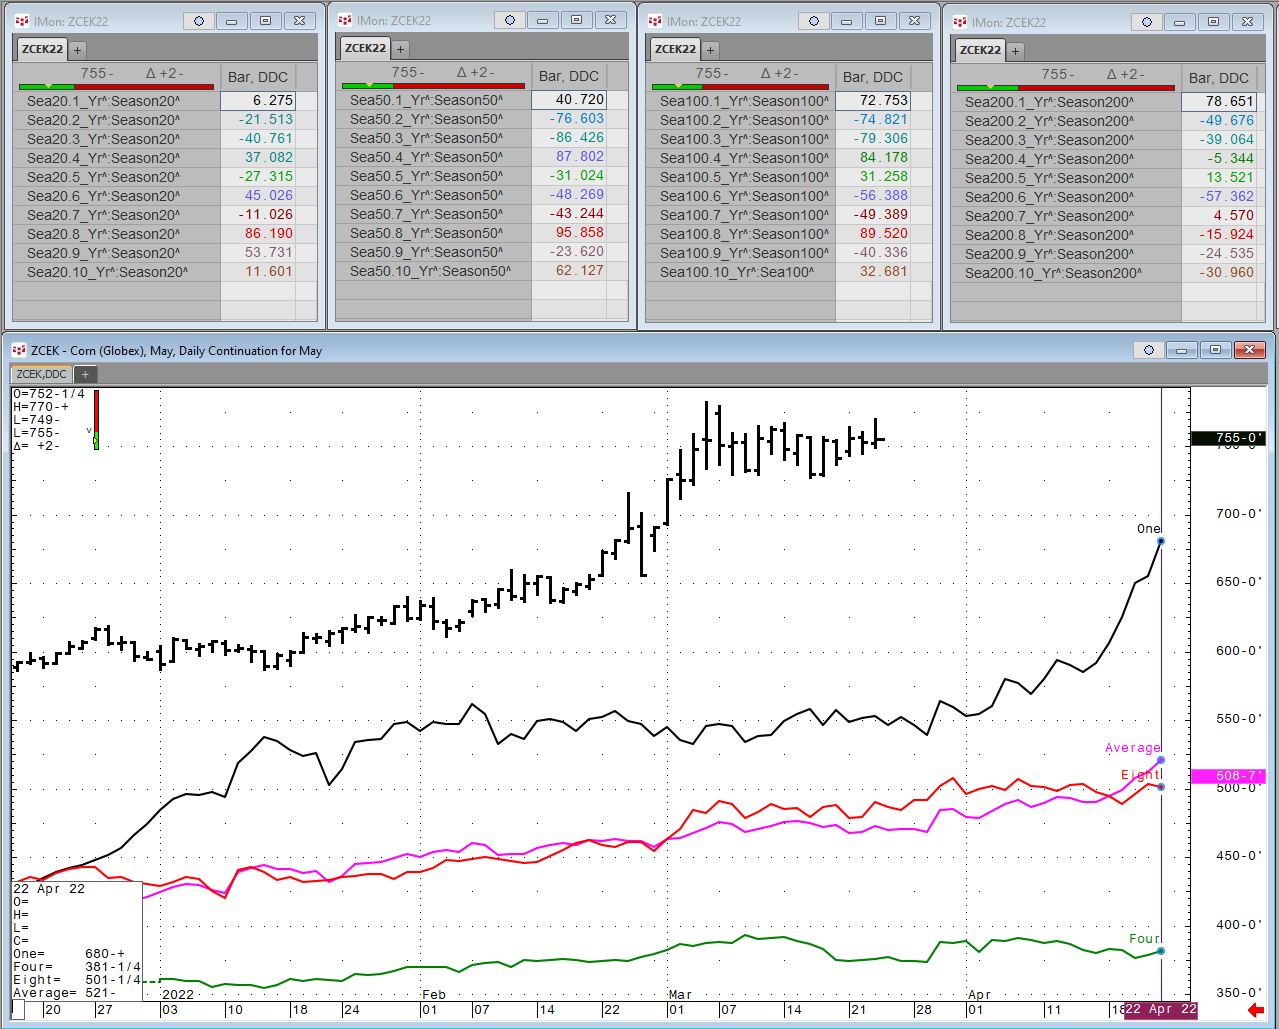
Each Wednesday this article will be updated with the current seasonal study using CQG’s Seasonal analysis applied to the Soybean, Wheat and Corn markets. You can download the CQG pac providing the… more
Blogs

Volatility exacerbated by a liquidity crunch that intensified price swings was a key characteristic of petroleum markets which fell for a second consecutive week after having reached 14 month… more
AT A GLANCE
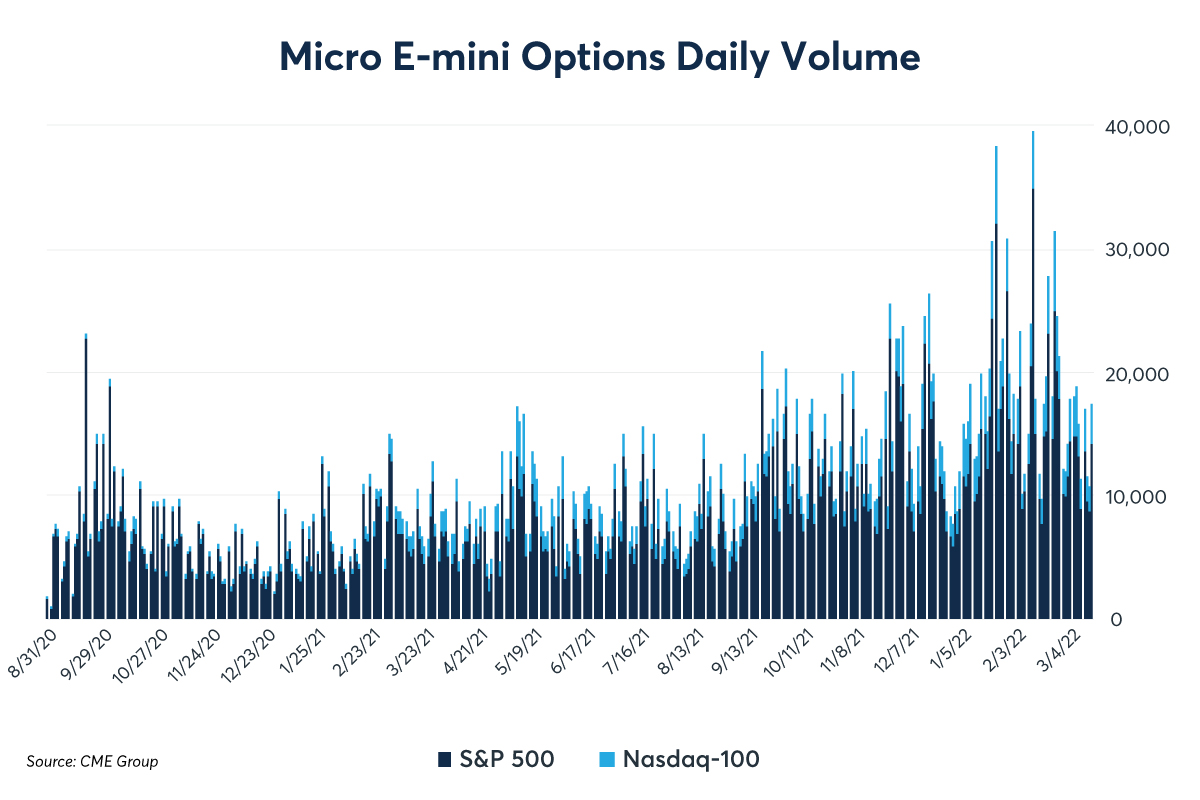
Micro E-mini equity options are tapping into industry demand for equity index products for a wider range of investors More options trading in 2021 coincided with a rise in… more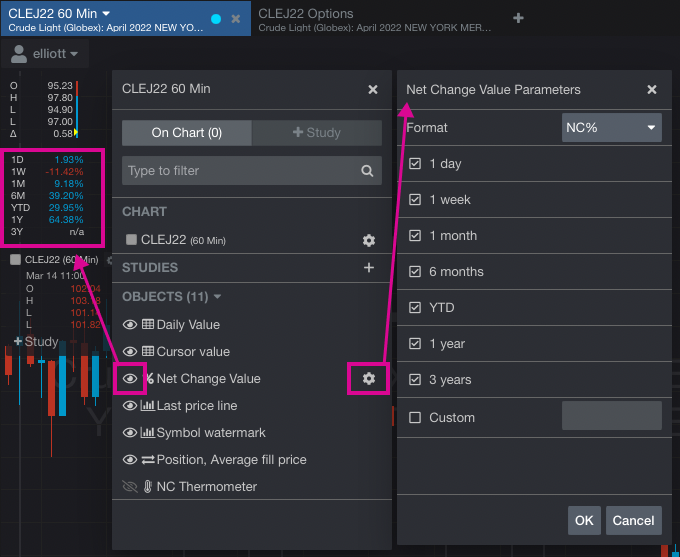
General
Added exchange names to symbol auto-suggest
Symbol auto-suggest shows more results
Charts
Added net change percent display for previous periods
Options
Greeks columns now available… more

Profound volatility was the primary feature of petroleum markets which had their first weekly loss since Russia’s invasion of Ukraine. Prices fell sharply after reaching historic highs on Monday.… more

There are so many things to consider when trading in the current climate. First and foremost, CAUTION is the key word, not FEAR. As Billy Joel would say, “We didn’t start the fire,” but as traders… more

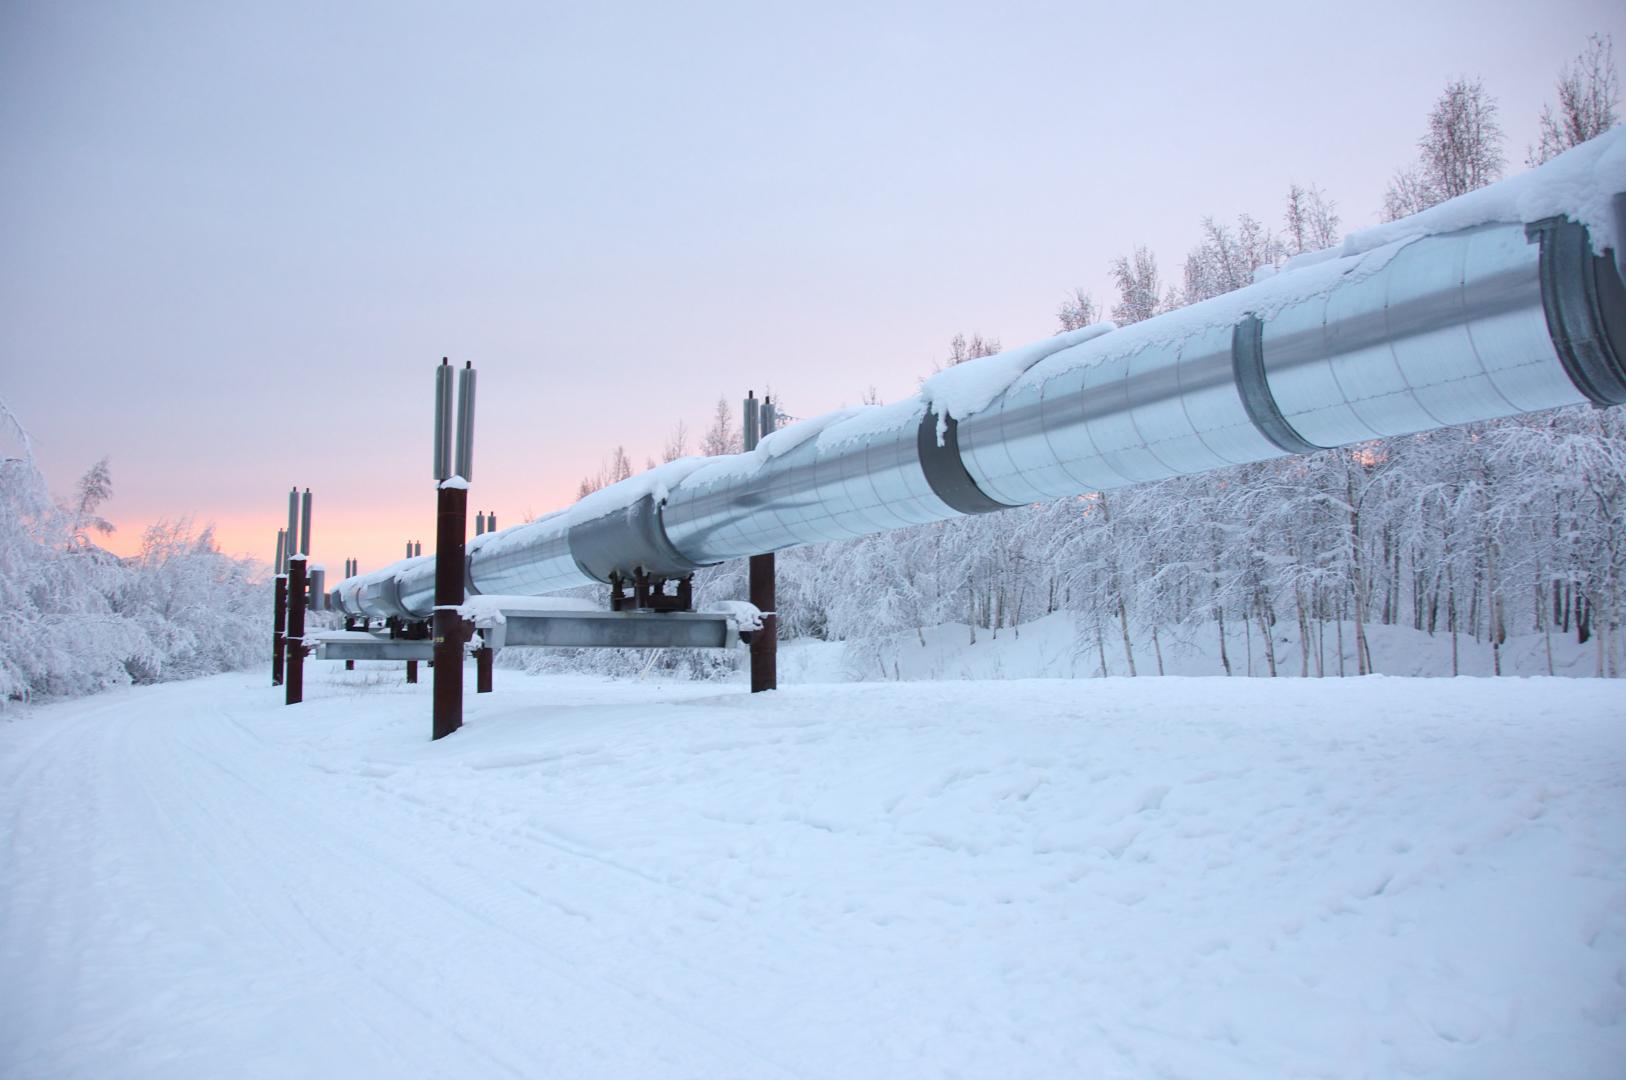
Russia’s invasion of Ukraine caused a historic spike in petroleum prices which registered their largest weekly gains in terms of dollars on record. Accentuating the week was the dangerous seizure… more
The first major war in Europe since WW II broke out in February with Russia’s invasion of Ukraine. At the beginning of March, the Ukrainian military and citizens continued to hold off the Russian… more
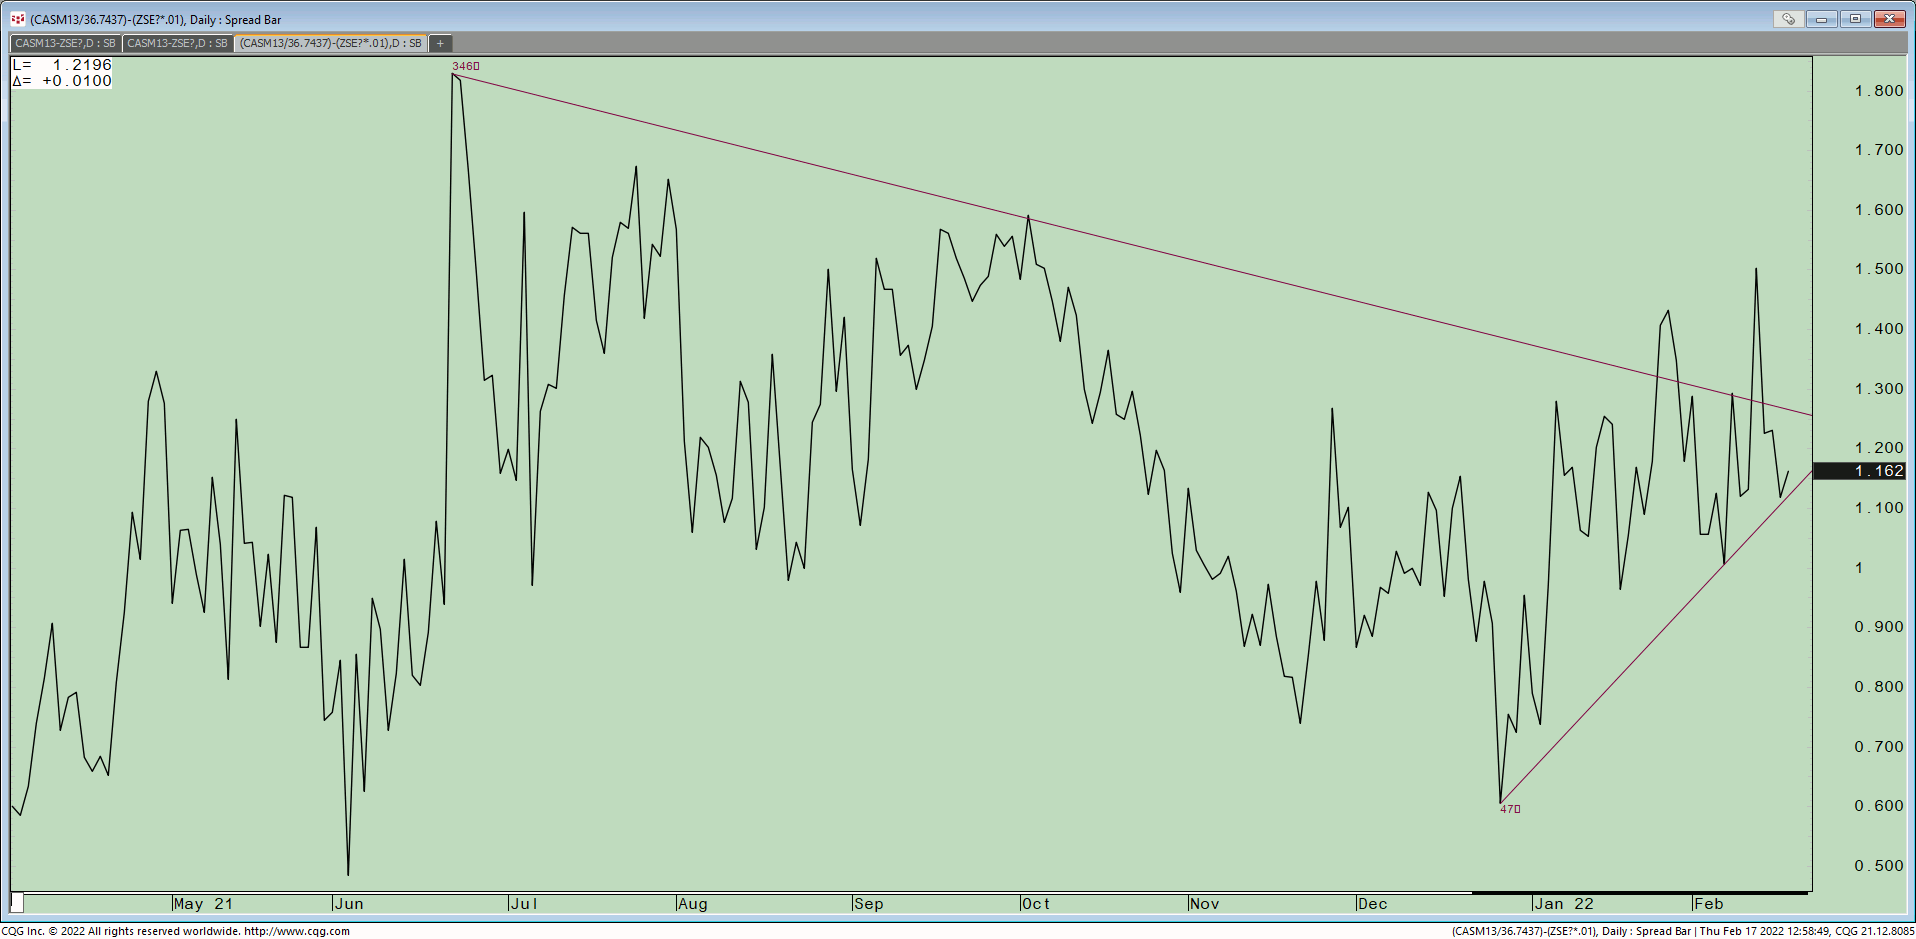
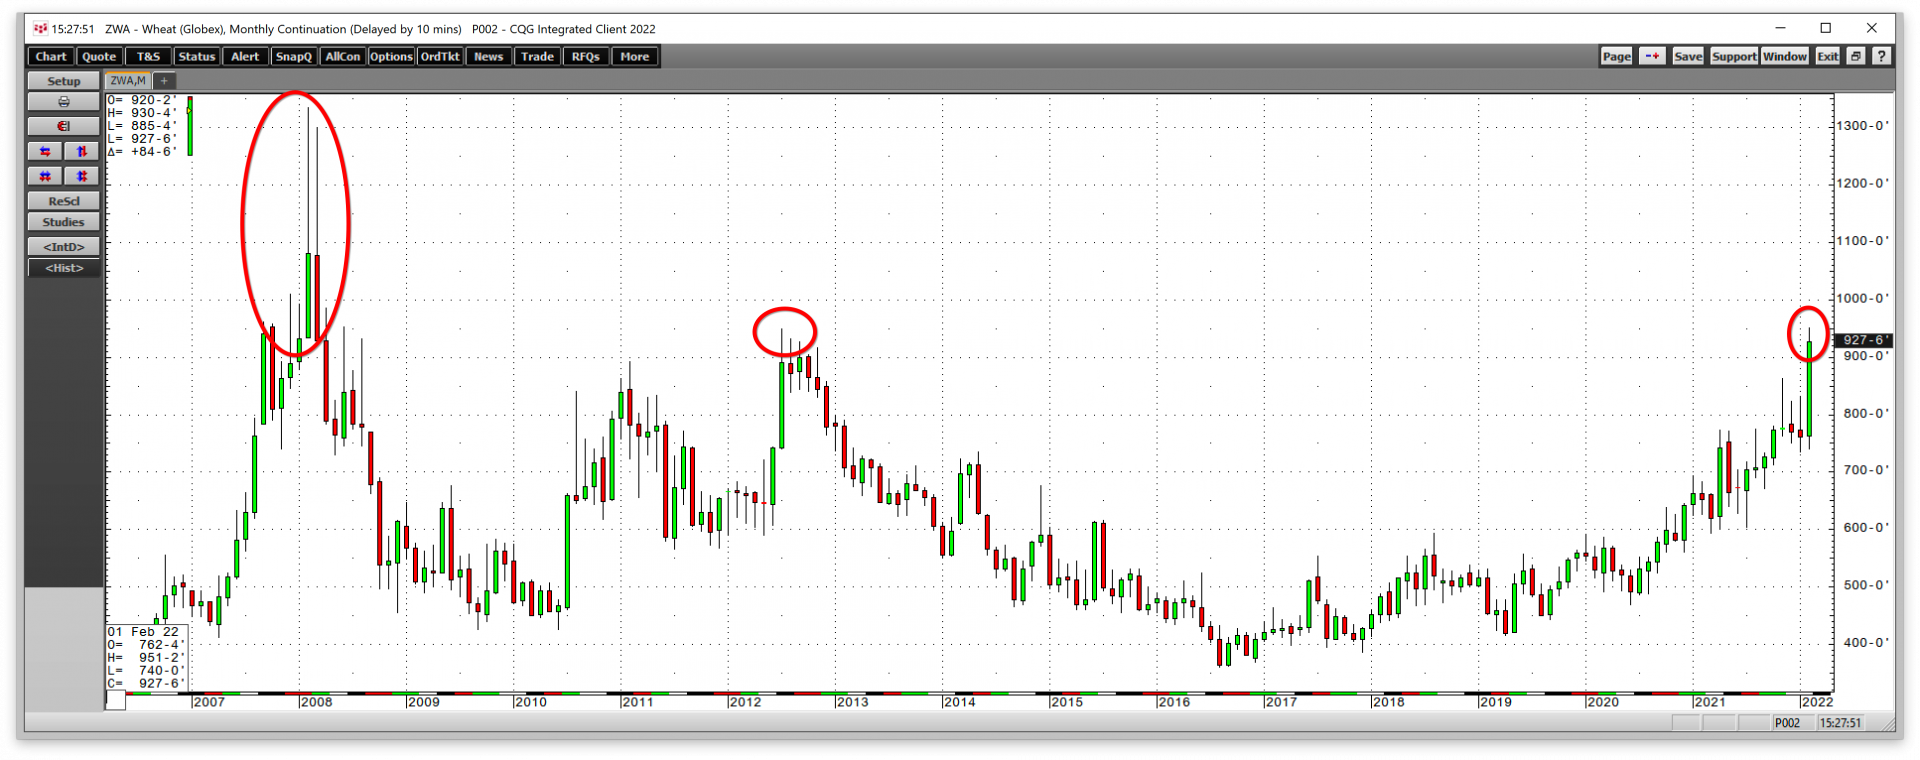
In this second of our series of articles on technical analysis for commercial hedgers we will look at using technical analysis to understand the basis and how it impacts the decision-making… more