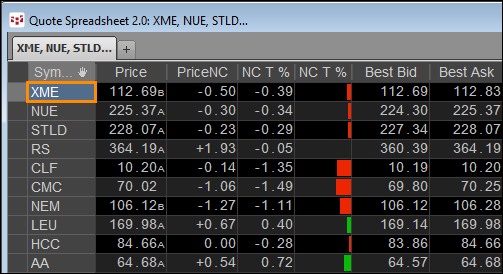
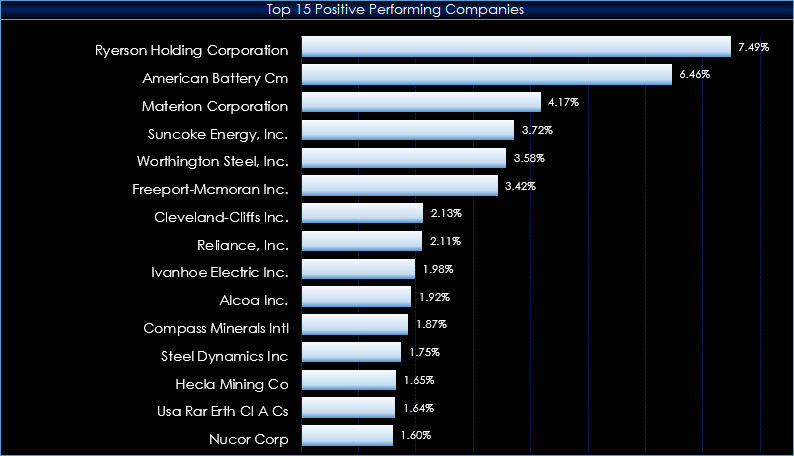
This post details a CQG PAC that is a CQG page that can be downloaded and installed to track the day’s performance of the holdings of the SPDR® S&P® Metals & Mining ETF.
From The… more
This post details a CQG PAC that is a CQG page that can be downloaded and installed to track the day’s performance of the holdings of the SPDR® S&P® Metals & Mining ETF.
From The… more
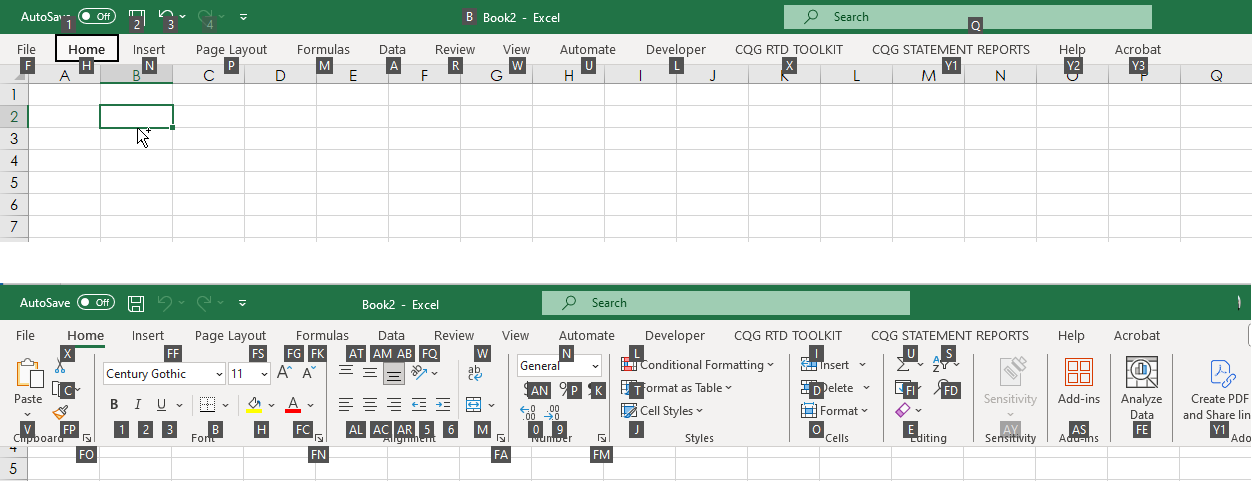
Knowing Excel Shortcuts will increase your efficiency with designing your Excel dashboards. There is a previous post, "Excel Keyboard Shortcuts," that detailed Excel shortcuts that eliminated… more
The S&P Metals & Mining Select Industry Index represents the metals and mining sub-industry portion of the S&P Total Market Index. This post details a Microsoft Excel dashboard that… more
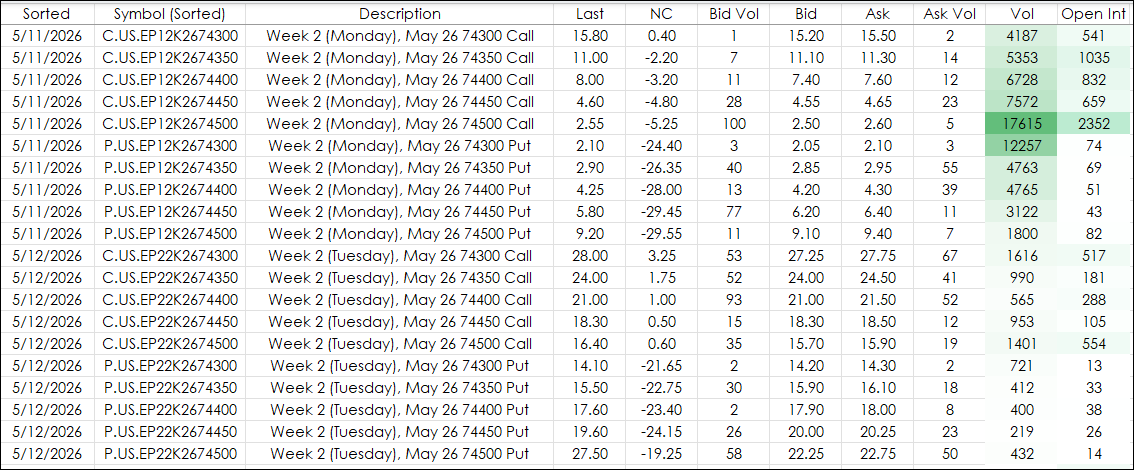
This options dashboard uses a combination of functionality from the CQG RTD Toolkit and Excel functions including SORT, FILTER, and RIGHT to track the options market. The markets monitored are the… more
The Excel DGET function extracts a single value from a column of a list or database that matches conditions that you specify.
The syntax is DGET(database, field, criteria).
The DGET… more
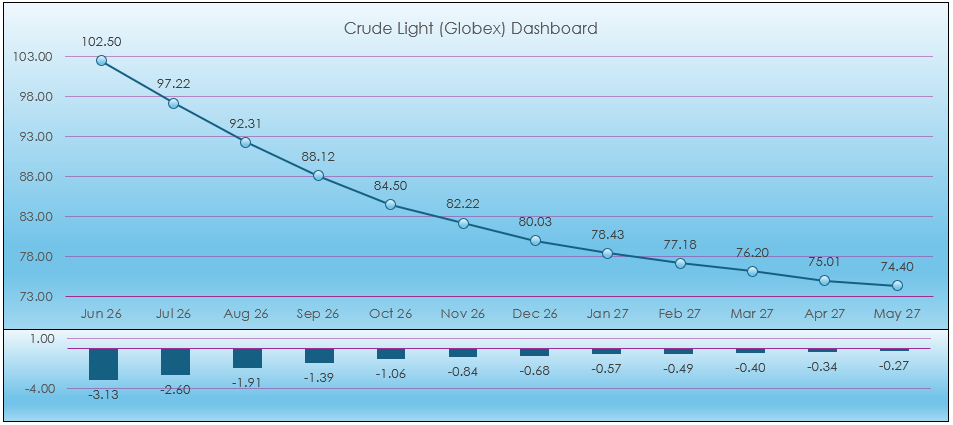
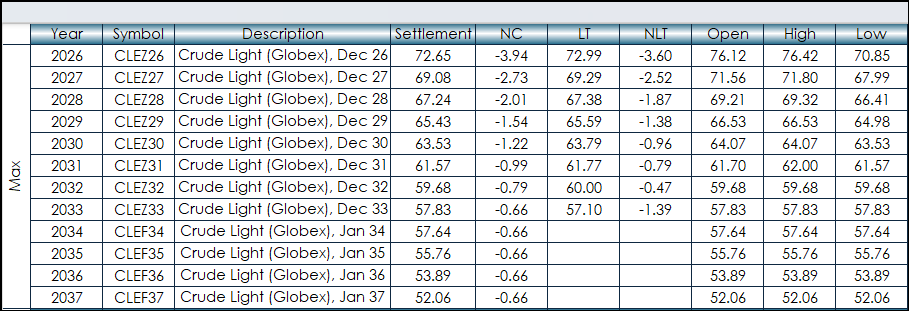
This post presents a macro enabled Excel Light Crude Oil dashboard using combined functionality detailed in previous Workspace posts. The dashboard uses numerous RTD calls for today's market… more
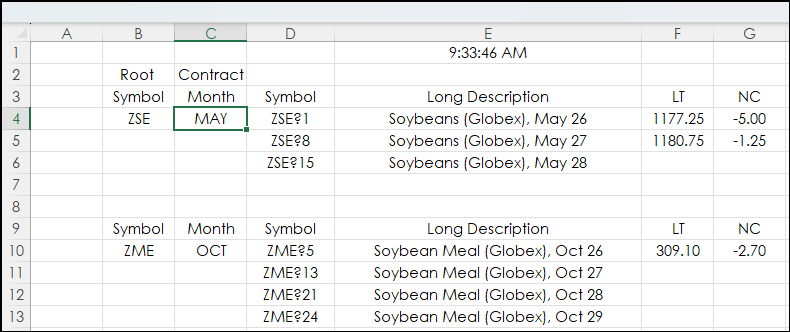
This post builds upon the post: Excel Agriculture Dashboard Using the FILTER Function.
The original post built market quote display blocks using a data tab with specific row ranges employed… more
The ARK Space & Defense Innovation ETF (Symbol: ARKX) goal is an actively managed ETF seeking long-term growth of capital by investing in domestic and foreign equity securities of companies… more
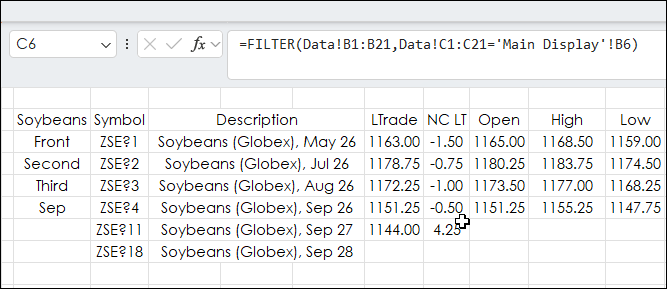
This Excel dashboard tracks agriculture markets and uses Excel's FILTER Function to pull the same month's contract data from each year.
The markets tracked are Soybeans, Soybean Meal,… more
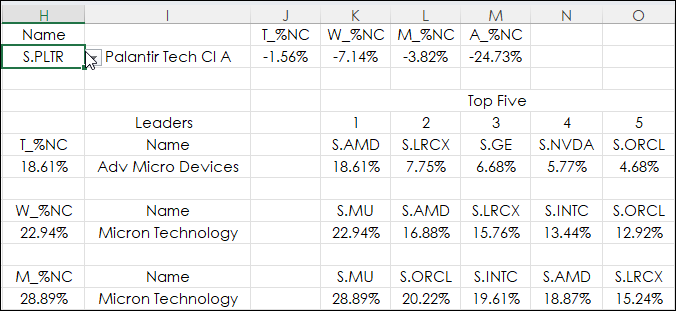
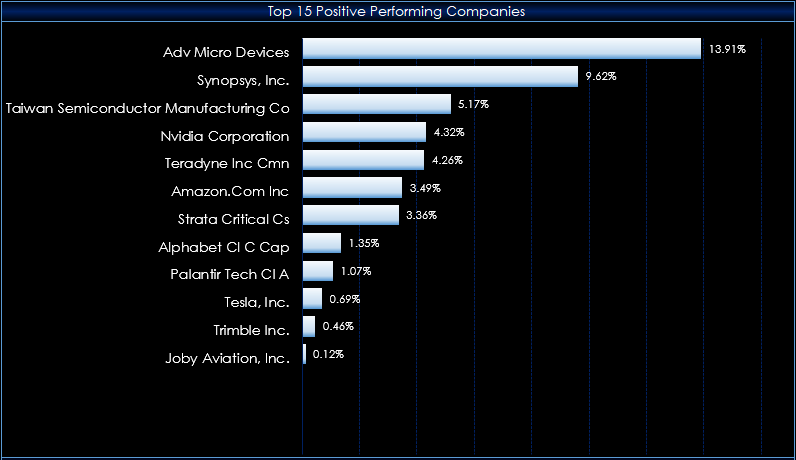
This post is similar to the recent post "Excel 365 GROUPBY and XLOOKUP".
That post introduced using the Excel function GROUPBY to arrange by sectors the stocks in the NASDAQ 100 and identify… more