If you are an analyst, blogger, or simply want to post a screen capture of an IC or QTrader chart on social media then the steps to copying a screen capture to your clipboard are very easy.
… more
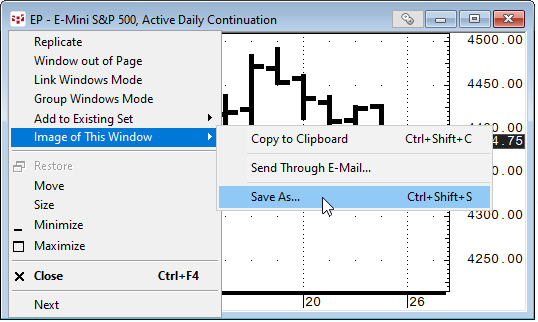
If you are an analyst, blogger, or simply want to post a screen capture of an IC or QTrader chart on social media then the steps to copying a screen capture to your clipboard are very easy.
… more
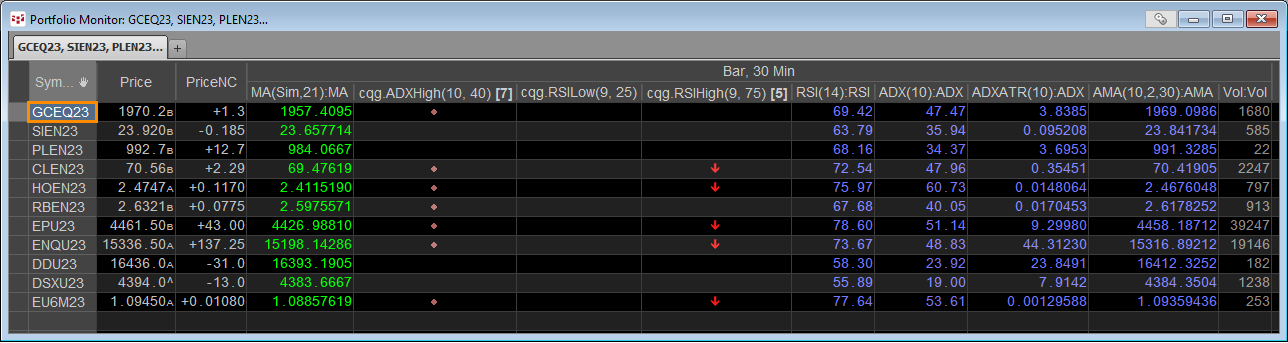
The Portfolio monitor is a combination market quotes and study values display. In addition, the Portfolio monitor can display the status of conditions, such as a study has hit an overbought level… more
This Microsoft Excel® dashboard displays all of the JPX-traded Japanese Government Bonds (JGB) contracts including volume and open interest data.
The first three columns detail the… more
This Microsoft Excel® dashboard displays all of the JPX-traded Three-Month TONA contracts including volume and open interest data.
The first three columns detail the contract month… more
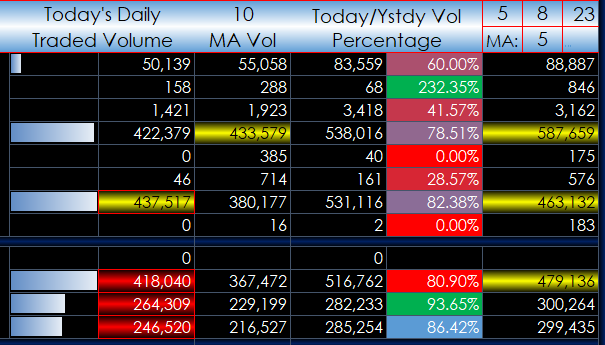
This Microsoft Excel® dashboard displays all of the ICE-traded Three-Month SARON contracts including volume and open interest data.
The first three columns detail the contract month… more
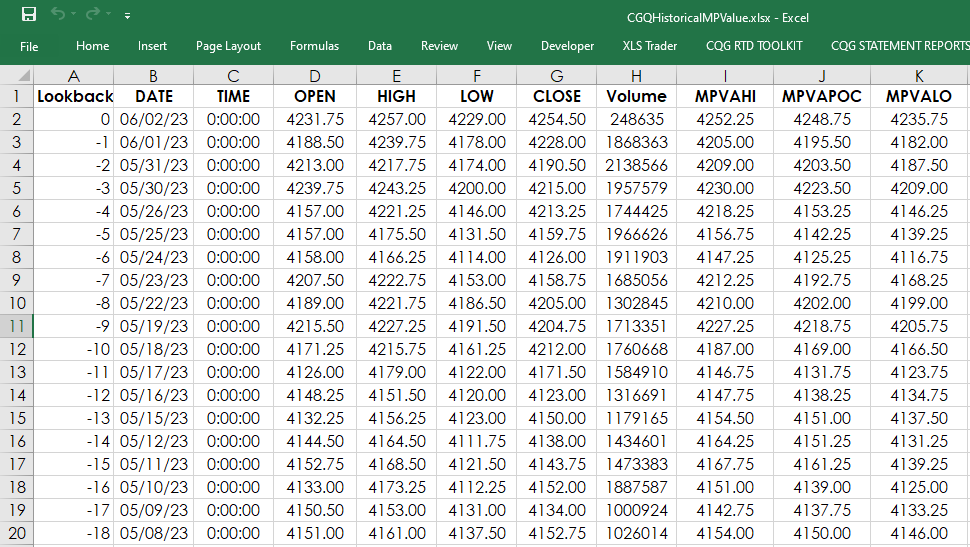
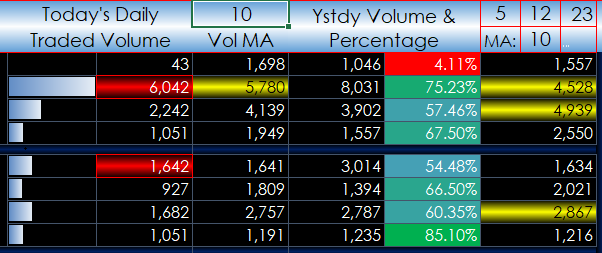
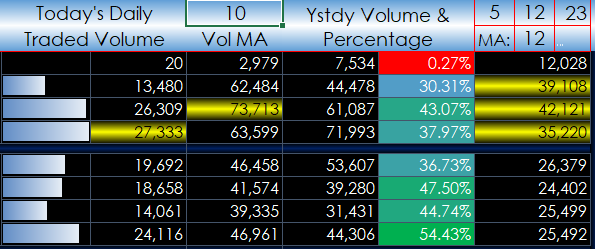
This study calculates the Market Profile’s value area and point of control (POC). First, a brief overview of the Market Profile chart then the Excel RTD formulas for MPVAPOC, MPVAHigh and the… more
This Microsoft Excel® dashboard displays all of the ICE-traded Three-Month SONIA contracts including volume and open interest data.
The first three columns detail the contract month… more
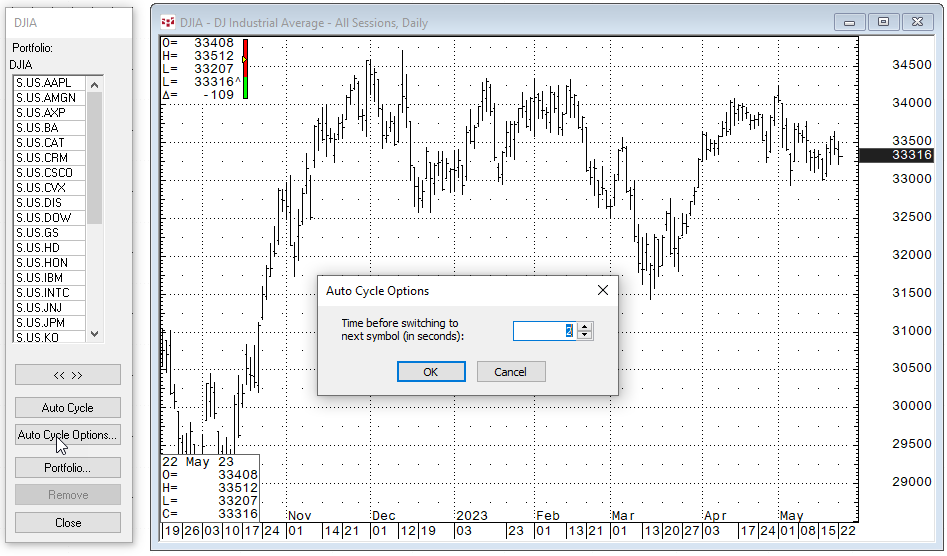
CQG IC and QTrader have a portfolio manager that enables you to create a portfolio of instruments. Once a portfolio is created a common use is for CQG IC users to run a Market Scan testing various… more
This Microsoft Excel® dashboard displays all of the Globex-traded Three-Month SOFR contracts including volume and open interest data.
The first three columns detail the contract… more
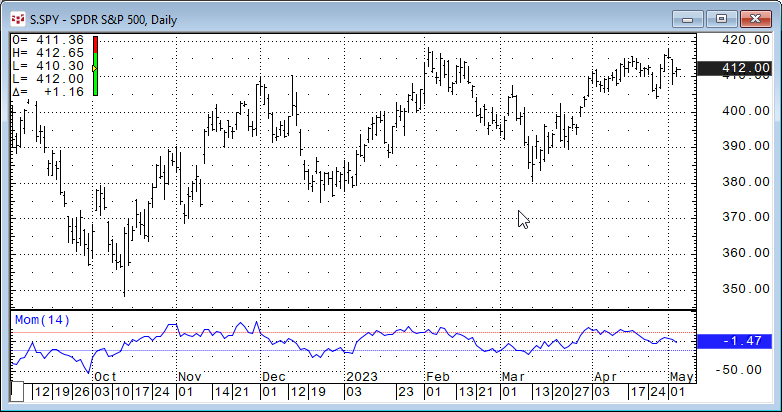
Oscillators are very popular studies used by traders and analysts alike. Oscillators detrend the price data by calculating differences. The next image displays a simple oscillator named Momentum.… more