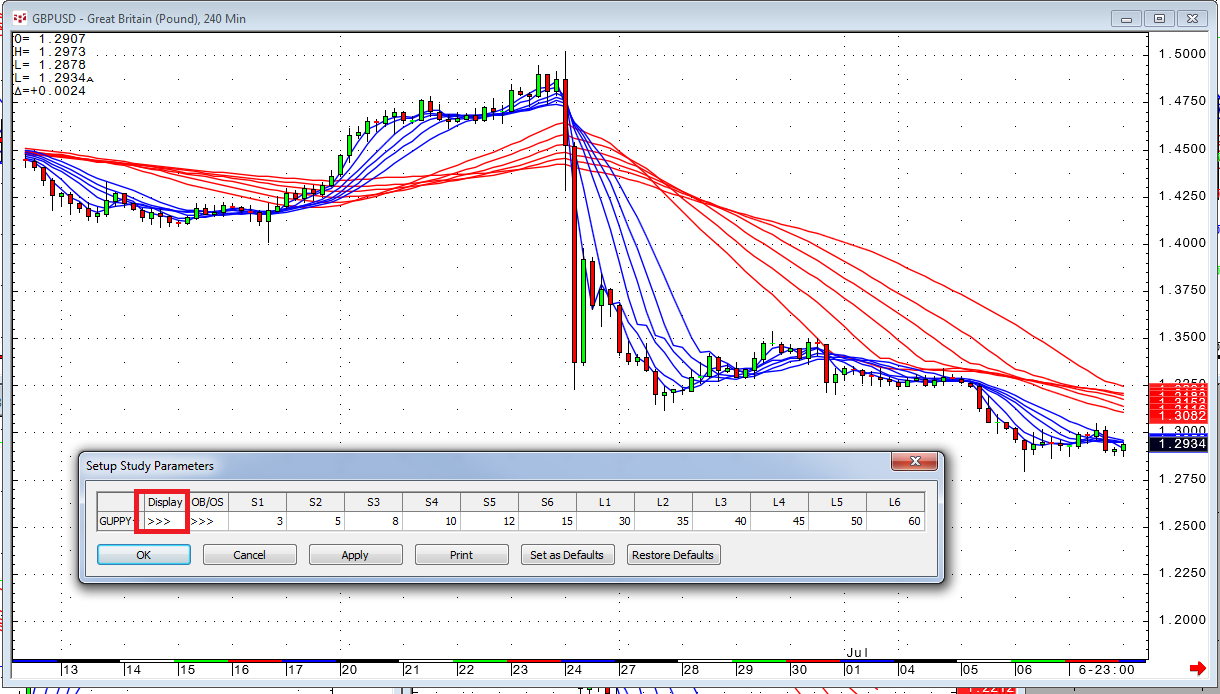
The Guppy Multiple Moving Average is an indicator used in technical analysis to identify changing trends. The technique is based on combining two groups of moving averages with differing time… more
Blogs
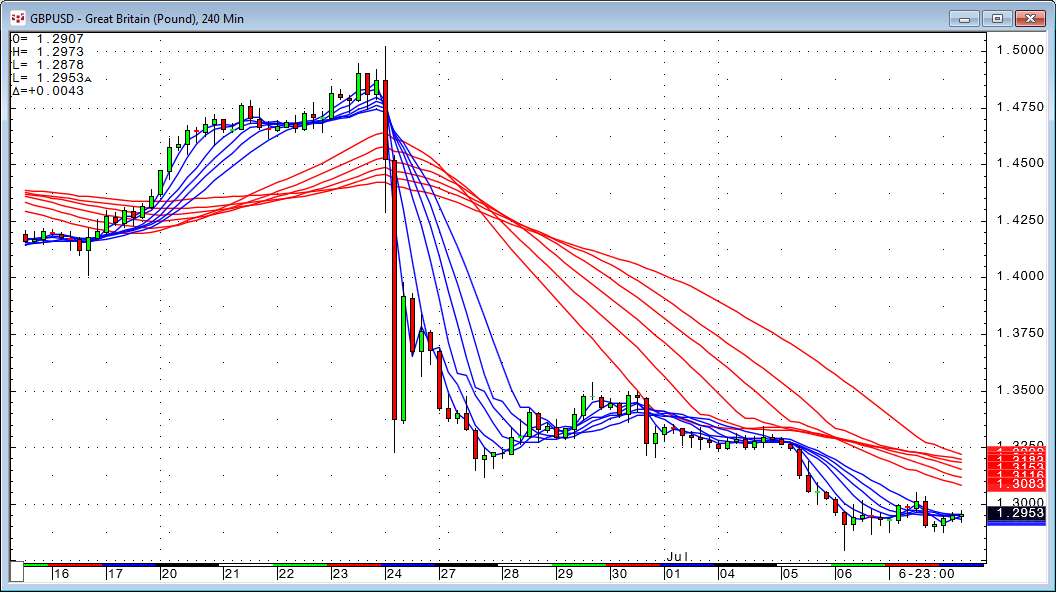
The Guppy is an indicator used in technical analysis to identify changing trends. The technique is based on combining two groups of moving averages with differing time periods.
One set of… more
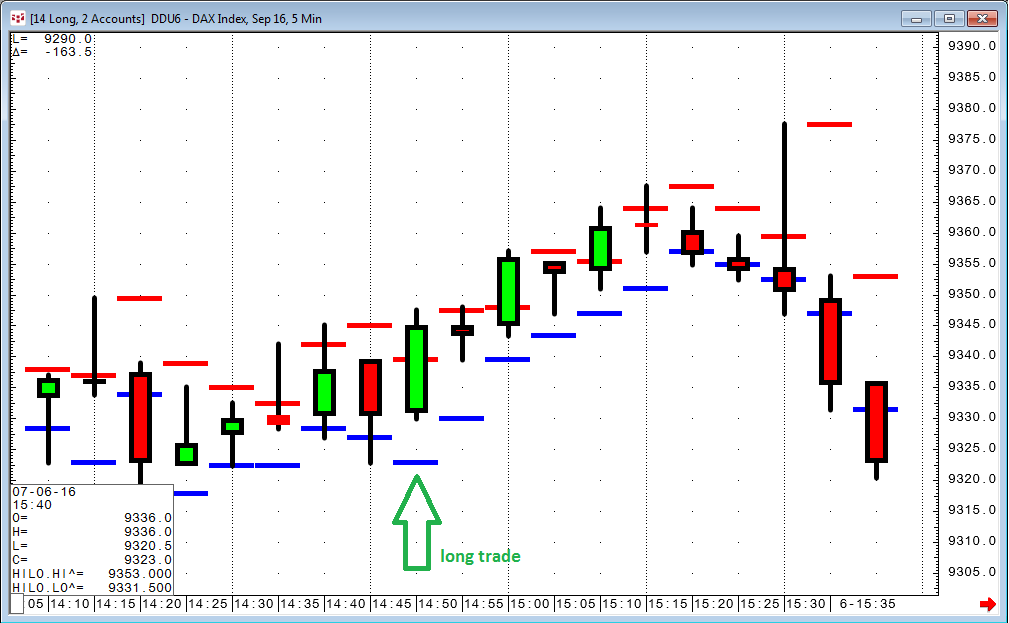
Sometimes it is not necessary to write a complex trading system when you want to accomplish something minor in the trading environment. For example, CQG provides built-in trailing stop… more
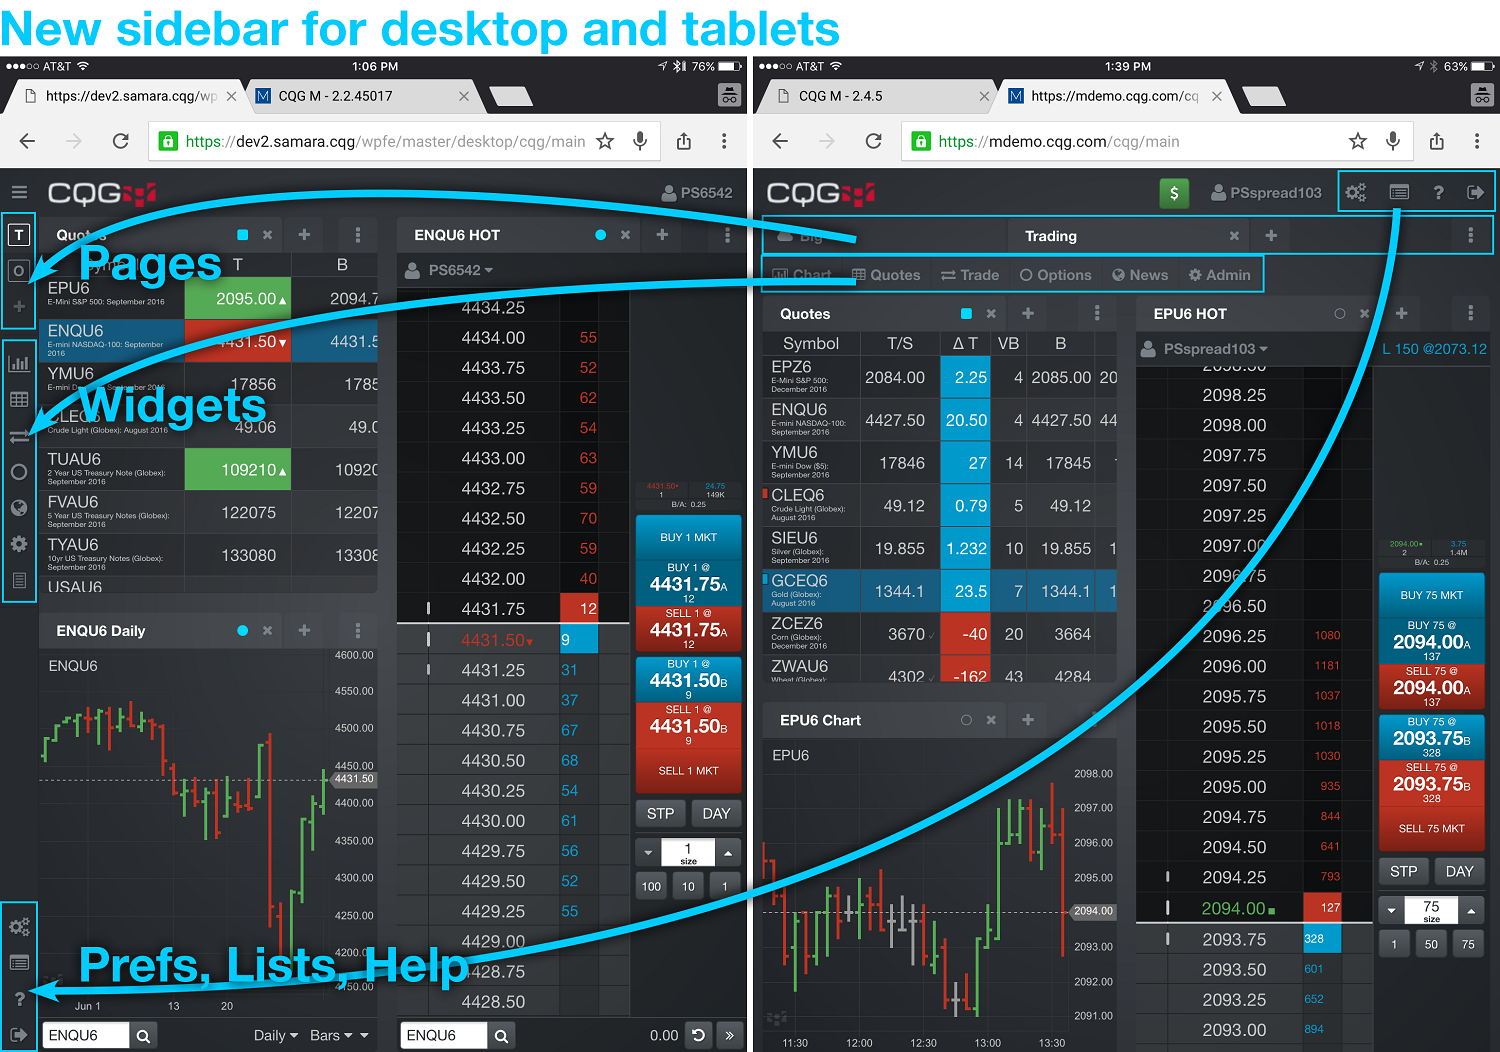
In an effort to improve the real estate usage at the top of the app for desktops and tablets, the next release (2.4) will have a change that will optimize some vertical space.
… more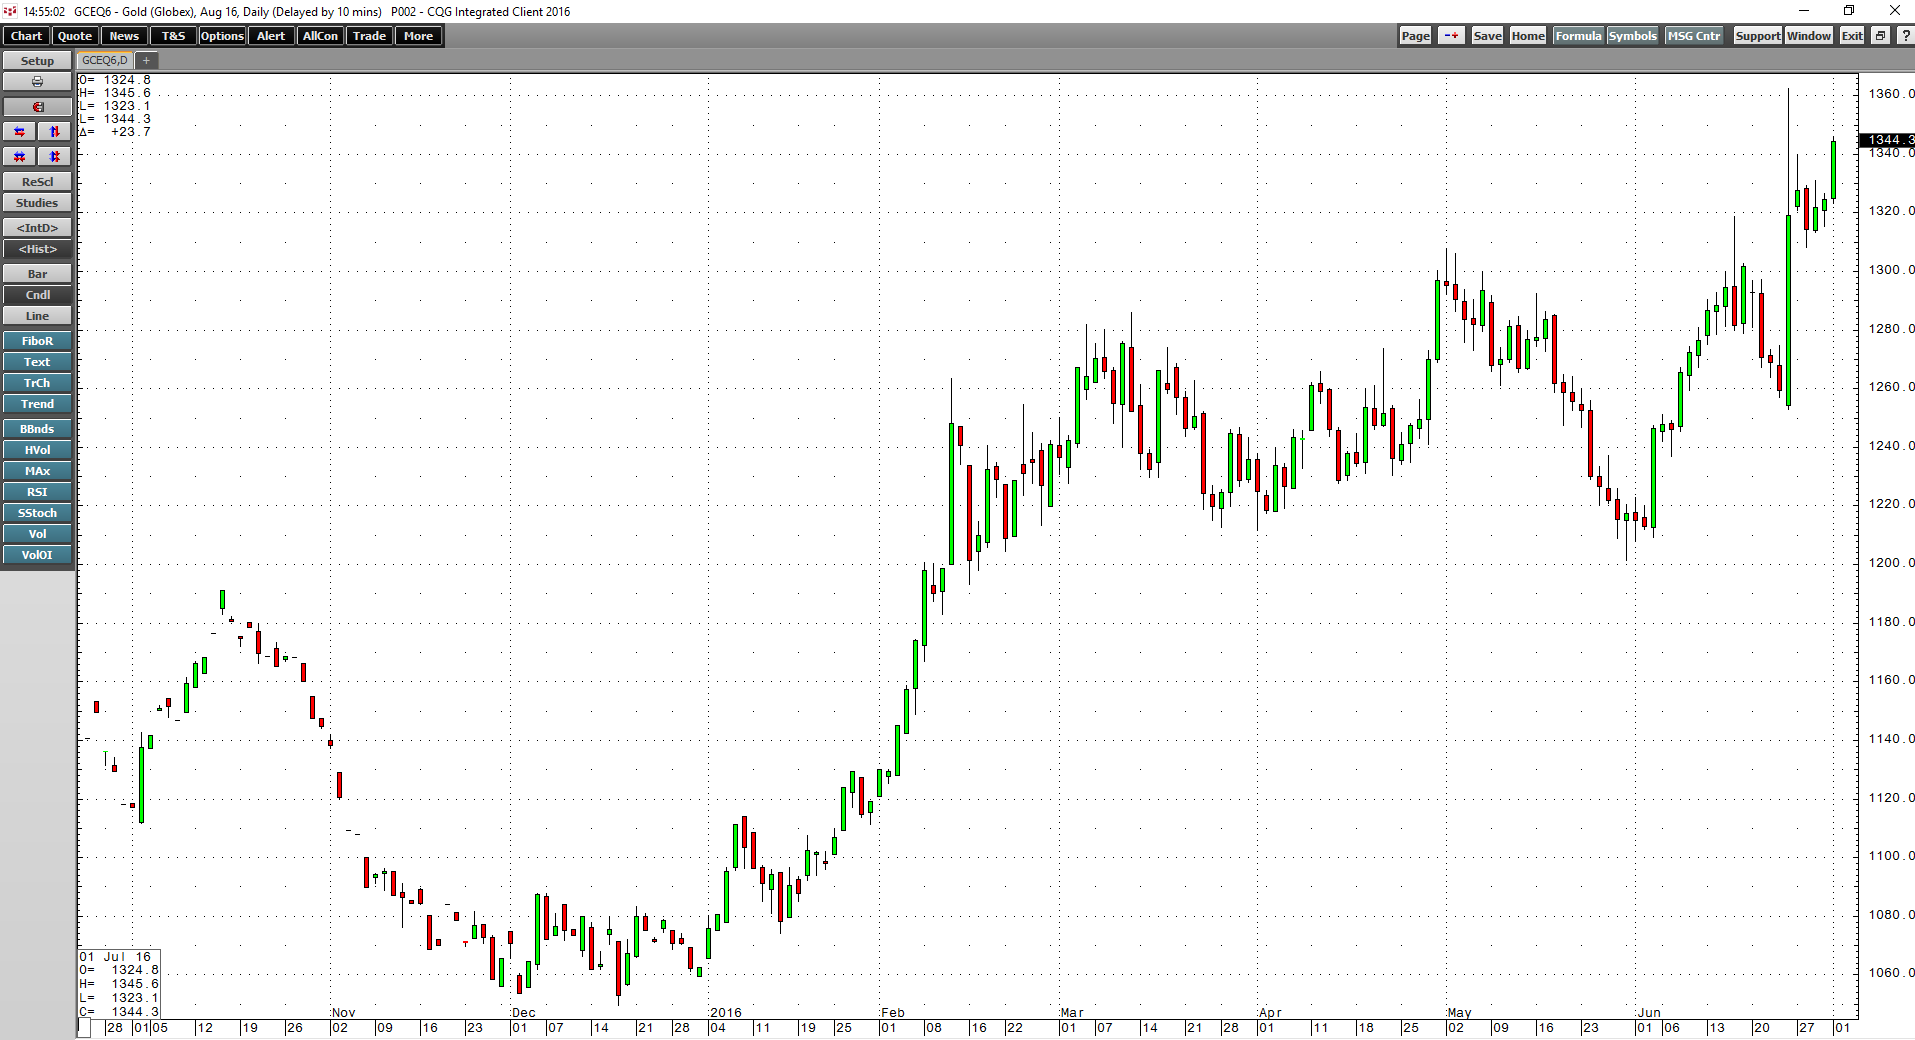
The second quarter of 2016 is now in the books. It was a quarter of fear of uncertainty, volatility, and gains for commodities. Overall, a composite of the 29 primary commodities that trade on… more
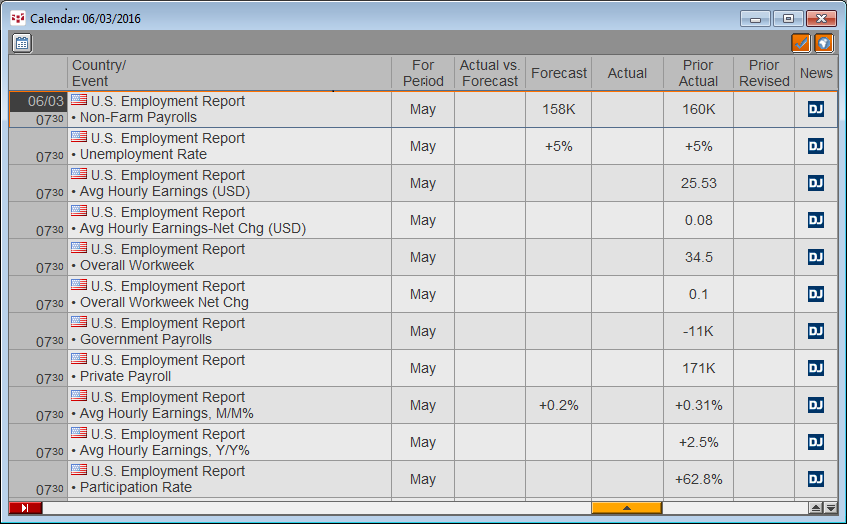
This Dow Jones News newsletter highlights some of the top coverage from Dow Jones' newsrooms around the world. The newsletter's focus is Resources, and coverage highlights include:
Exclusive… more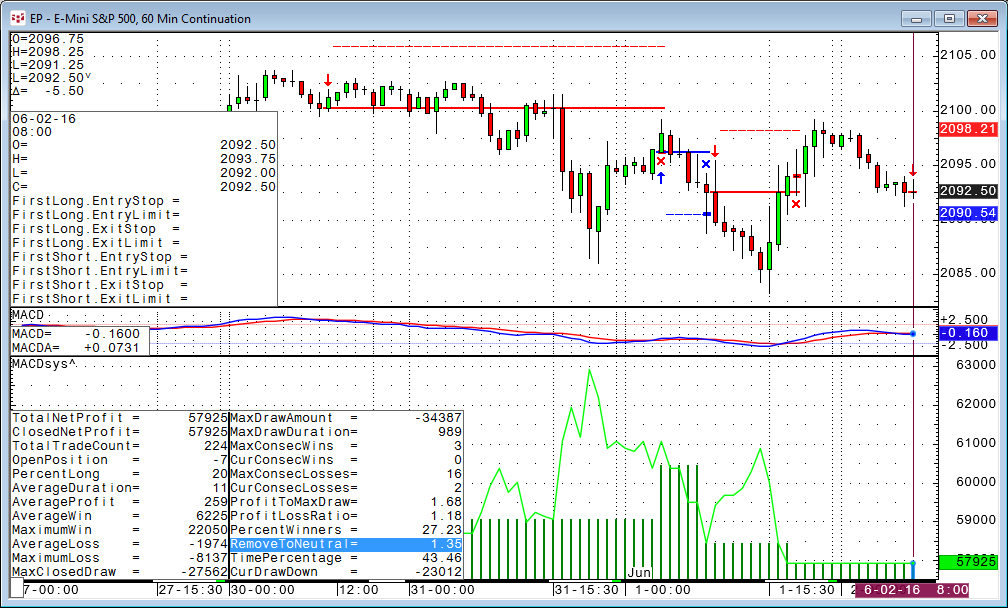
In my last blog post we turned the Super Template AMA trading system into a new trading system using MACD with a few steps. At first glance it seemed to be a losing system, but after we applied a… more
This Dow Jones News newsletter highlights some of the top coverage from Dow Jones' newsrooms around the world. The newsletter's focus is Resources, and coverage highlights include:
Exclusive… more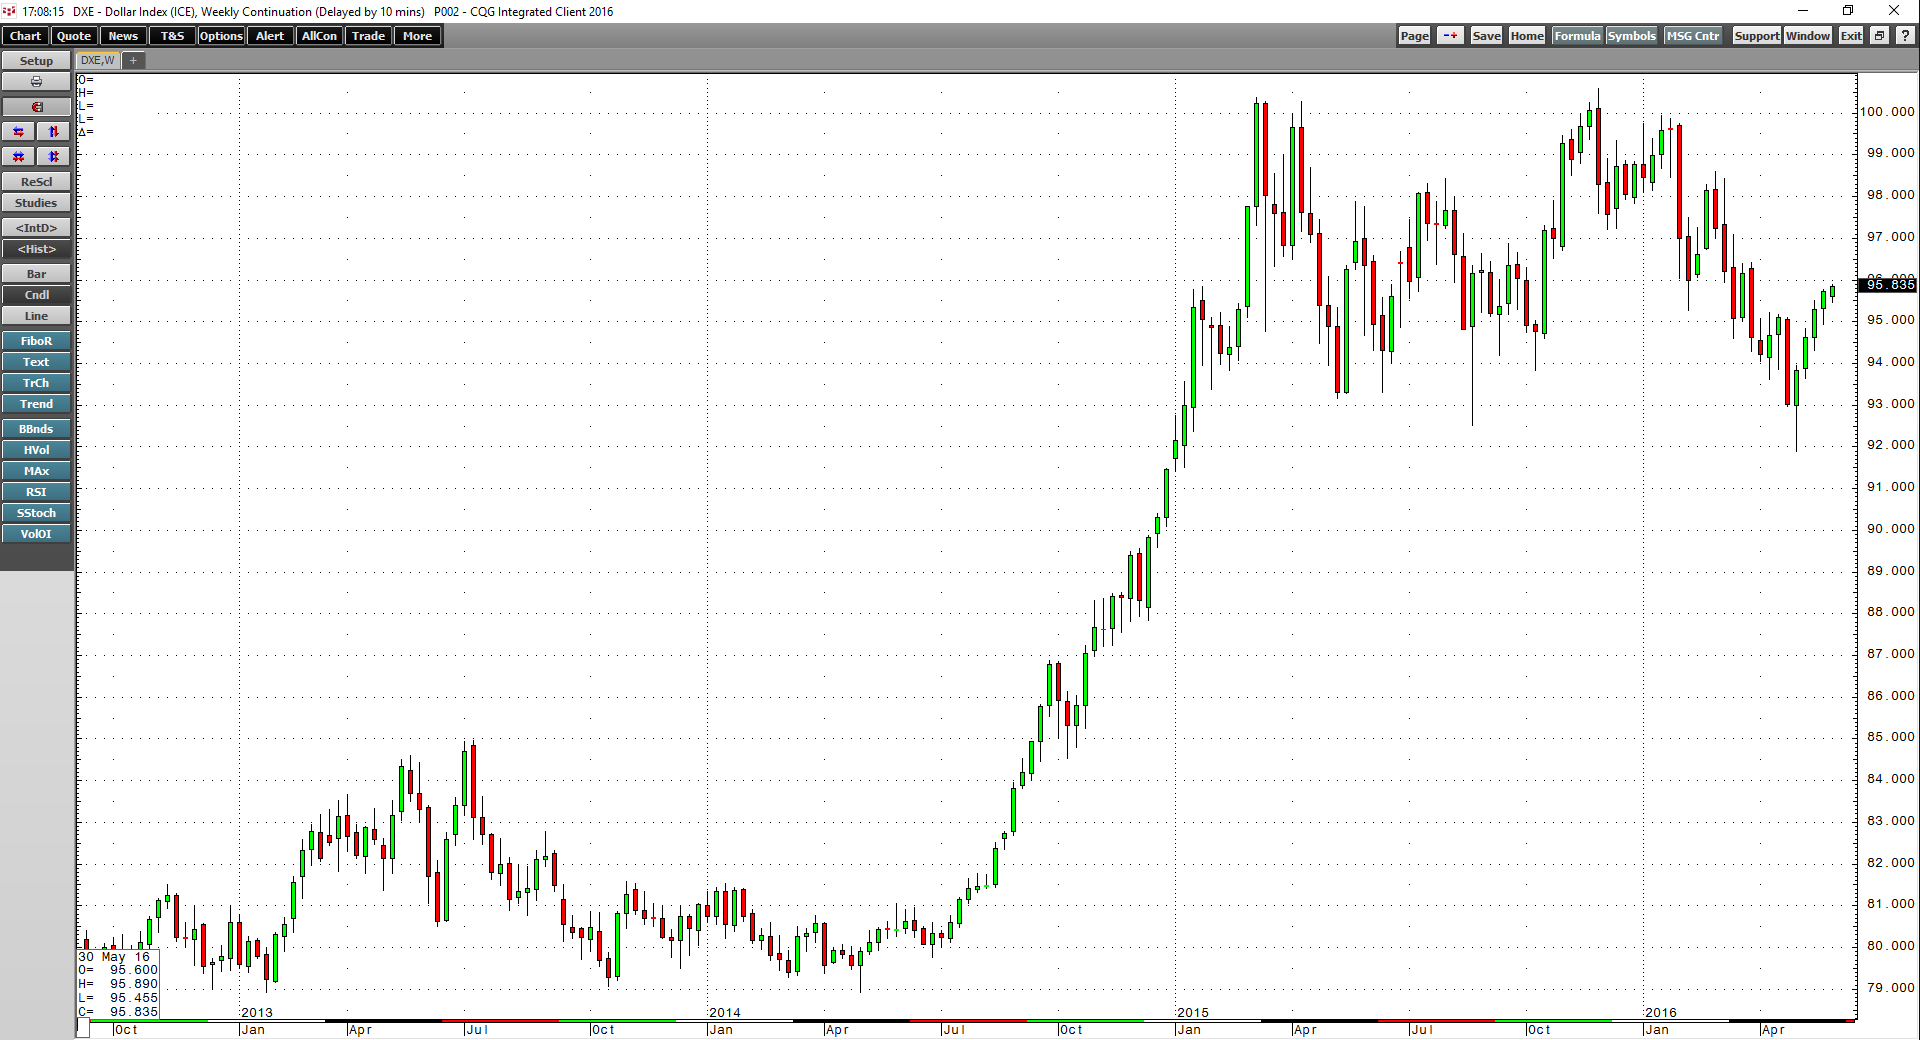
The US economy is the world’s largest. The US dollar has been the world’s most stable currency, and it is universally accepted as the reserve currency around the globe. The dollar is the benchmark… more
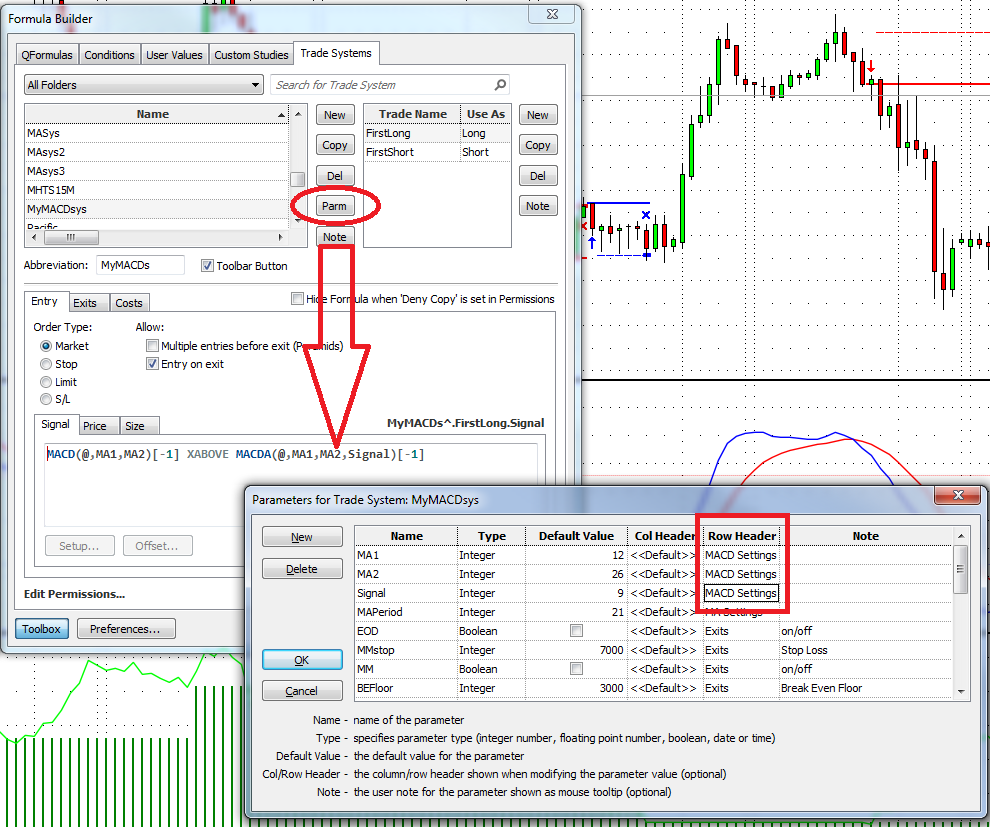
This is a quick-start guide to building your own trading system based on the Super Template. The Super Template comes pre-installed with CQG Integrated Client. As a basic example, we will create a… more