Presented by Financial Repression Authority.
CQG Integrated Client
Get a 2-week free trial

Presented by Financial Repression Authority.
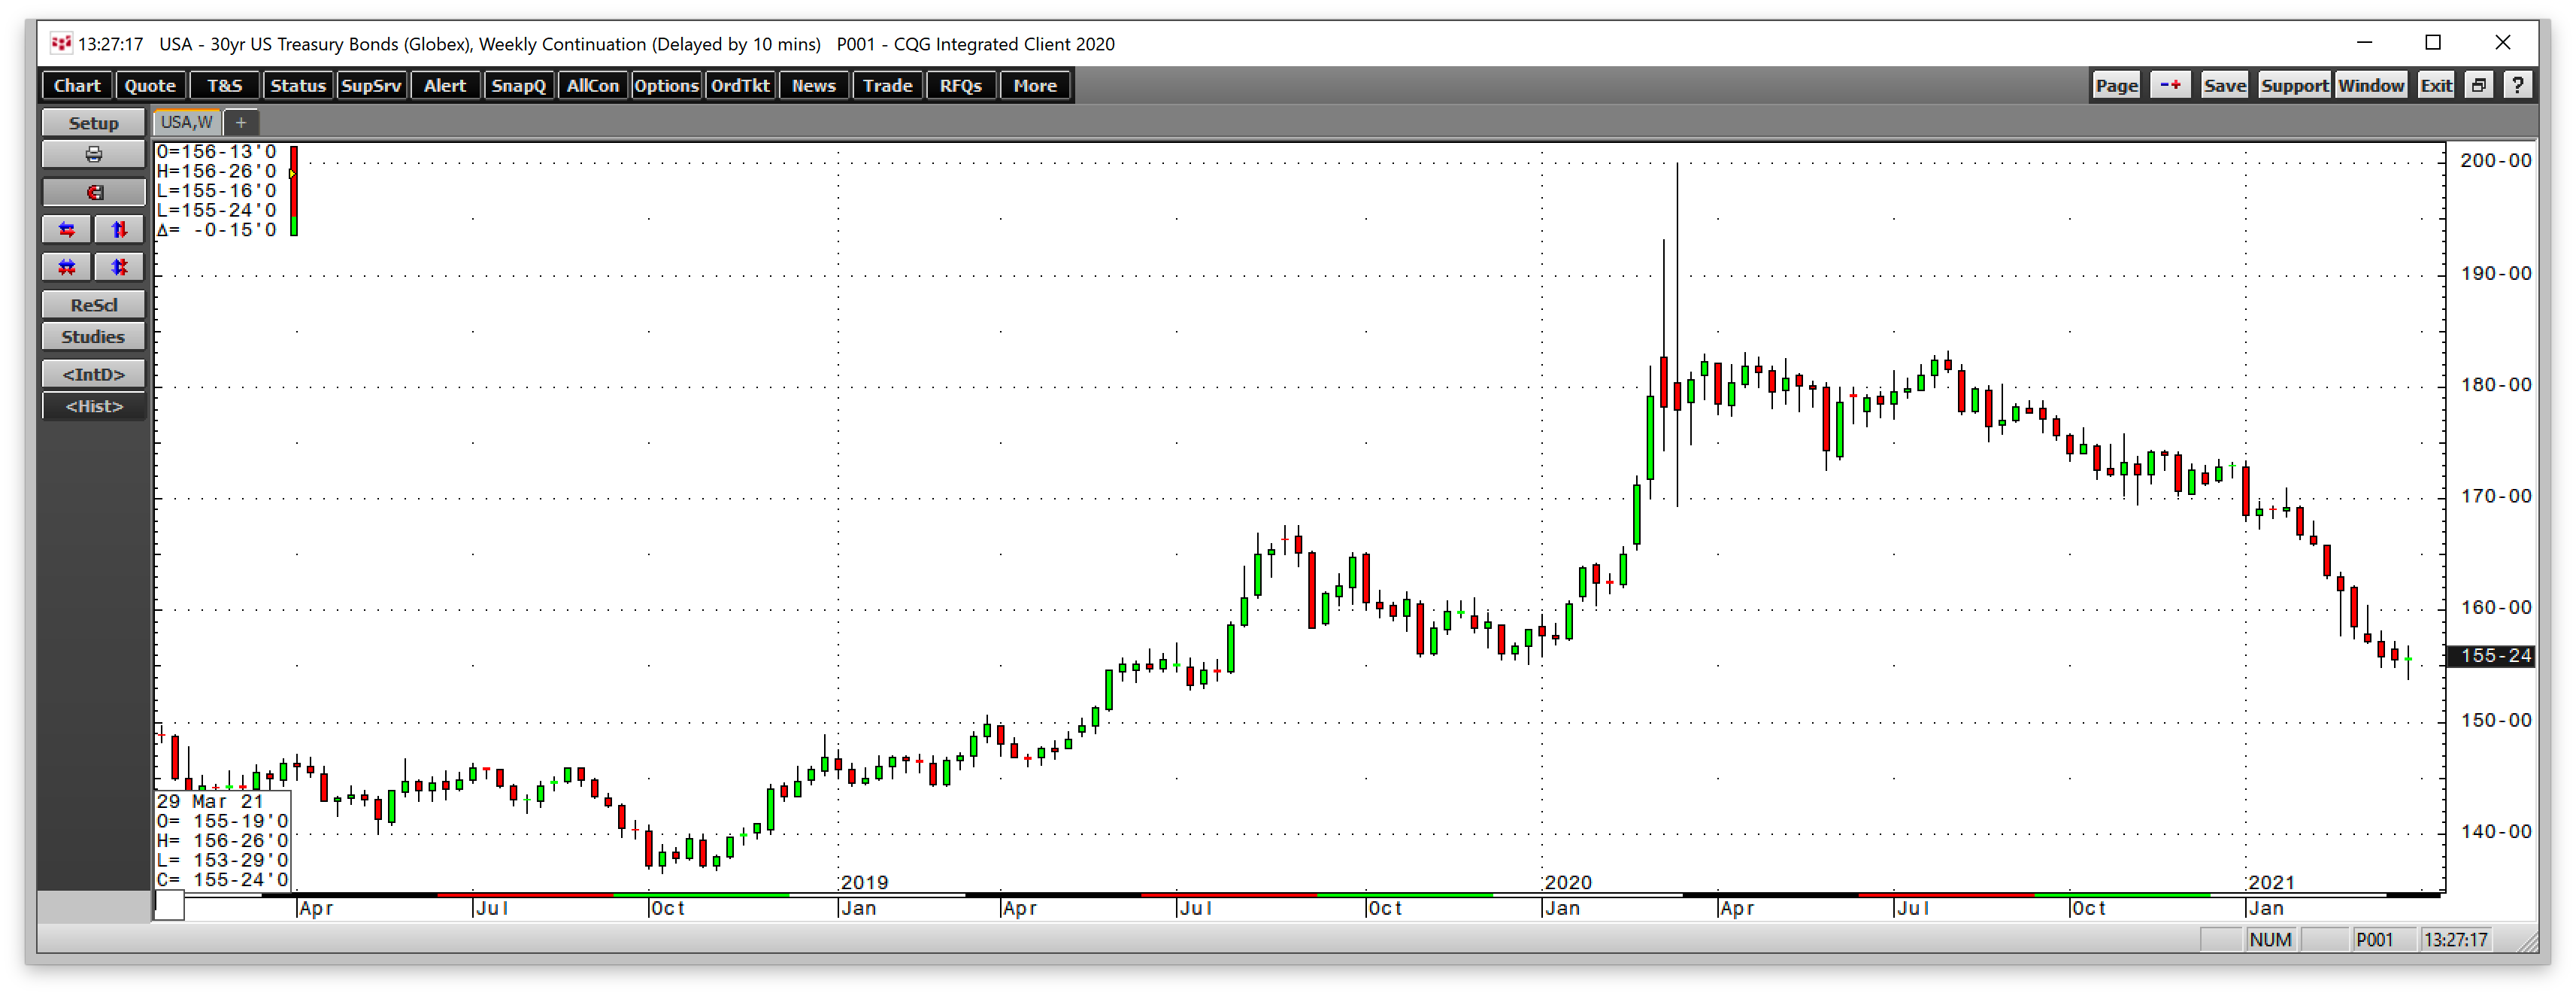
The raw material markets asset class moved higher in the first quarter of 2021 after a volatile 2020 when the pandemic caused a massive selloff early and a huge turnaround that pushed some prices… more
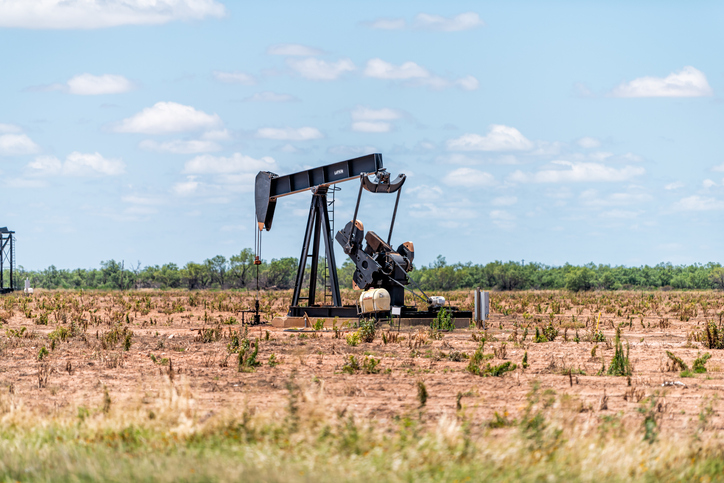
Petroleum prices increased in a holiday shortened week as key influences were somewhat mixed. A surge in refinery utilization to a one year high as Gasoline demand exceeds that of last year at… more
Petroleum prices ended the week mixed, settling near unchanged despite exceptional volatility with broad outright price swings throughout the week. WTI fell 0.7%, Brent gained 0.1% while RBOB… more

Presented by Financial Repression Authority.

Petroleum prices suffered their largest weekly loss since October, falling for six consecutive trading days before recovering slightly on Friday. Driven by a significant recovery in the dollar,… more

First, thank you to all who filled in for me as I spent nine full days packing up my life in Chicago. Raising four children and being the repository for many of my loved ones “stuff”… more

Presented by Financial Repression Authority.
Daniel Lacalle, PhD, economist and fund manager, is the author of the bestselling books Freedom or Equality (2020), Escape from… more
We hope that these updates help improve your trading workflow. We continually strive to improve your CQG Desktop experience. We invite you to… more